astroimagej Error when plotting
12


12
|
Hi,
I've recently been trying to use AIJ to turn image fits files into light curve fits file to be able to perform spectra analysis on some exoplanets for my masters dissertation, I can import the images and see (on some image data) a clear night sky of stars, I pick the one which is most centred and using recommended settings from online I do the aperture. Once I've placed all the apertures and I press enter to get the light curve, every single of my points gets this error 'fitPanel wait = 5000msec Waited 0.0 seconds for plot to finish before closing MP panels. ***ERROR: No signal for centroid in aperture C2 of image hst_14500_01_wfc3_ir_g141_20_drz.fits. ********: Measurements are referenced to the non-centroided aperture location' I've searched how to fix it but since I'm very new to AIJ, I don't know which part I'm doing wrong. I can provide the data I'm using if it'll help. Thank you, Brandon |
Re: astroimagej Error when plotting
|
Administrator
|
Hi Brandon,
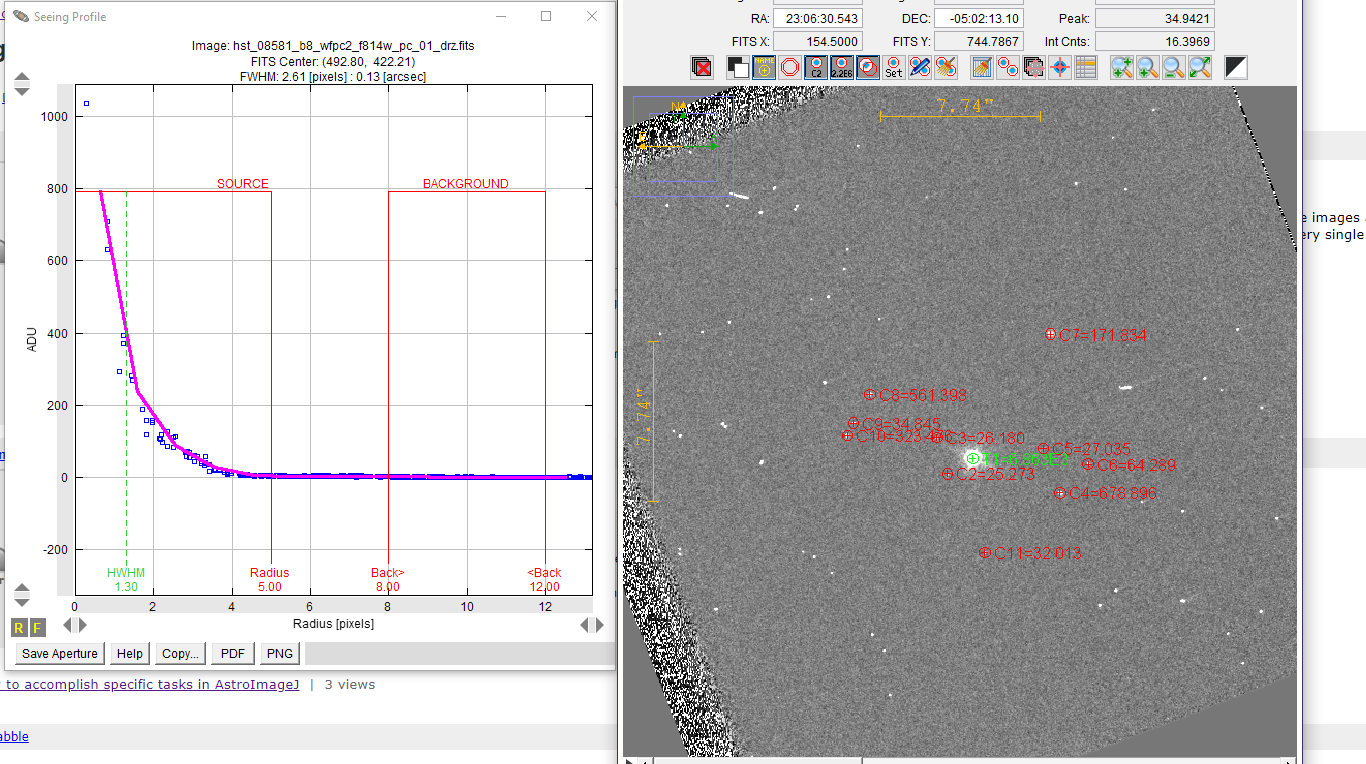
Could you post a screen snippet of your first image in the stack that shows how your apertures are placed relative to the stars in the image? Also, let us know which OS and AIJ version your running (click the bottom line of the toolbar and report the information that appears there). If all else fails, we may need to eventually get your data and some AIJ configuration files (which we would specify). Karen |
|
Hi,
I've attached the picture of the apertures and im running windows 10 with AIJ running on 5.3.4.02.  Brandon |
Re: astroimagej Error when plotting
|
Administrator
|
Hi Brandon,
Thanks for letting us know your OS and AIJ version. That combination is well-tested, so we'll need to keep digging. It looks like C2 centroided fine on the star in the first image. Is there a similar star at the same place in the second image? Could you post a screen snippet of the second image (like the one below from the first image) after you have seen the error messages? Karen |
|
Hi Karen,
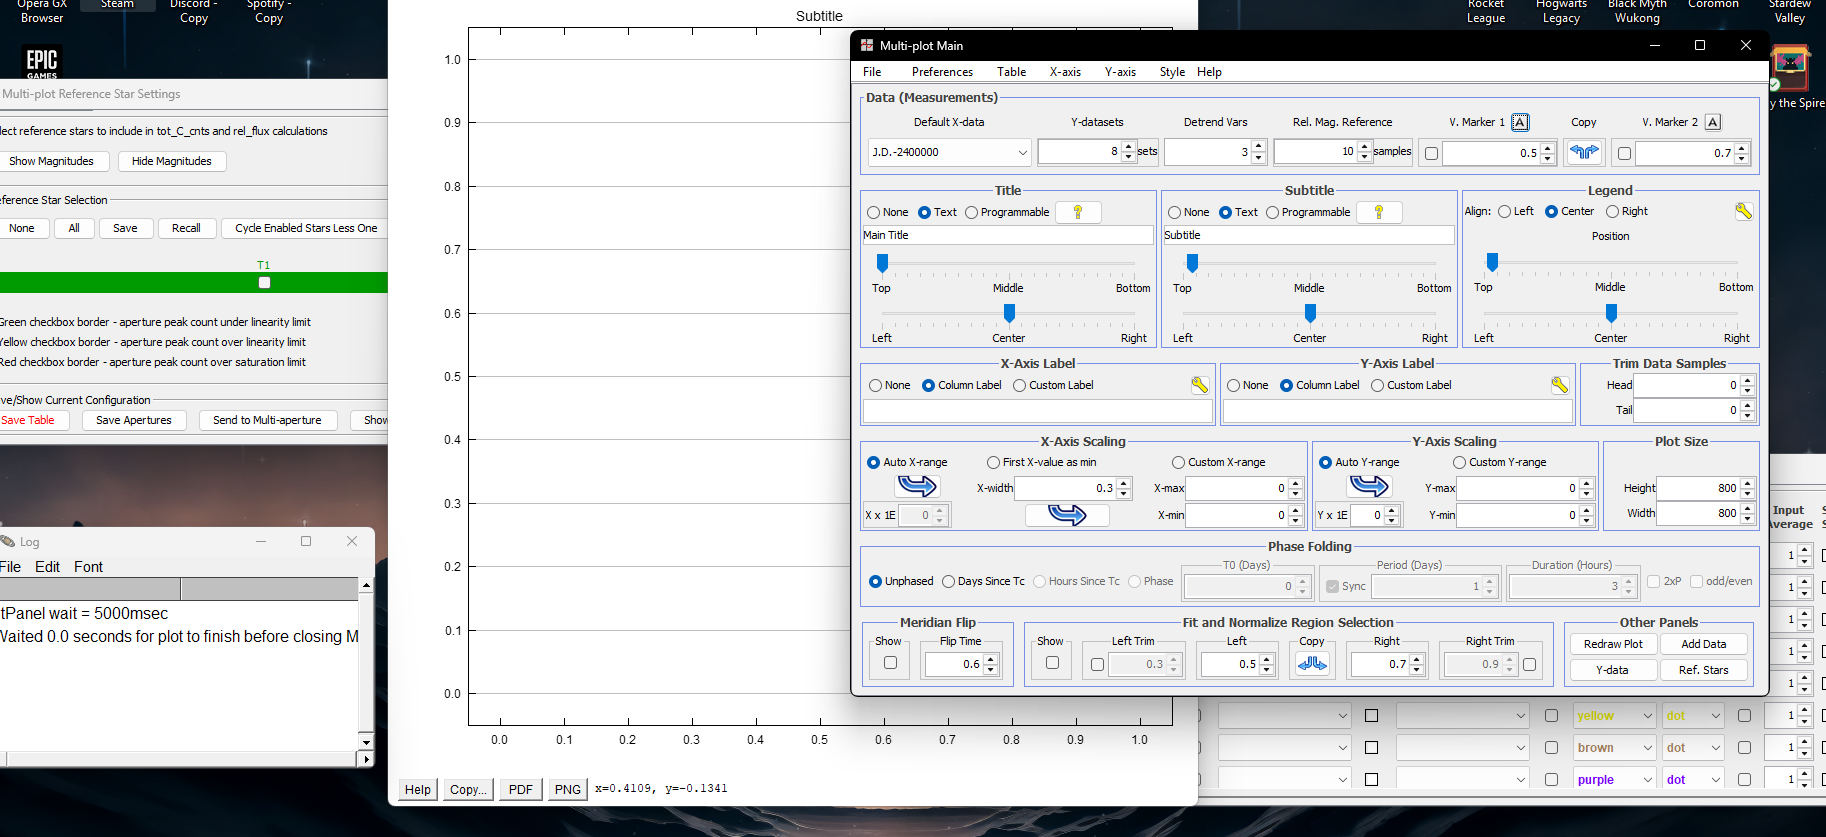
I did email you as to why my reply here is so late, seemed like nabble had an error on my end when i tried to access the site, I'll put here the pictures of the other images. The capture 1 is the 2nd image in the sequence and capture 2 is the 3rd image in the sequence as this filter only has 3 image sequences, the star appears to be in the same place in each picture.   Brandon |
Re: astroimagej Error when plotting
|
Administrator
|
Hi Brandon,
I don't see much flux at the location of T2 in the second and third images. Based on the flux I see in the bottom image above, I think only the medium bright star to the NW of the target star is the only one that is useful as a comp star. Could you trying running with that single comp star to make sure AIJ is then working as expected with no errors or warnings? If that doesn't work, could you make the three corresponding fits files available to me using the email address you used when you sent the direct message to me (link to google drive or similar if the files are too big to email)? Also, so that I can recreate your environment on my machine, please open AIJ, attempt to run your photometry as you originally did, then open multi-plot if not already open (the plot icon on the AIJ toolbar) and go to Multi-plot Main > File > "Save all AIJ prefs to backup file" and send me that file as well (it should work as an email attachment). Karen |
Re: astroimagej Error when plotting
|
Administrator
|
Hi Brandon,
Also, if these are HST space-based images, I wouldn't expect you'd need comp stars at all. Instead just place a single aperture on your target star and then plot, fit, normalize, etc. the data column Source-Sky_T1 instead of rel_flux_T1. Karen |
|
Hi Karen,
Sorry for the late reply, uni has recently started again. Would the email be the outlook one correct? I've also tried different stars but it comes out as the same error, sometimes it doesn't show an error, but when it comes to the plotting, it says it took 0.0sec to plot, so I'm really confused. The data im using is HLA but from HST, just classified as HLA, so don't believe it makes much of a difference. I'll email the data i have via outlook for you. Thank you Brandon |
Re: astroimagej Error when plotting
|
Administrator
|
Hi Brandon,
I received your data and will attempt to duplicate the problem soon. Karen |
|
Hi Karen,
I'm not sure if you were able to receive my recent emails okay, i was just wondering how its going with my data? Thank you, Brandon |
|
Hi Brandon,
I've tried running with the sample images you sent us with your prefs file. Other than the two center stars, I don't think there are any that can be used. As Dr. Collins said you may want to stick with just T1 for these. I noticed the third image (hst_08581_b8_wfpc2_f814w_pc_drz.fits) is missing timing information. If you run only with T1, so you still get an error? Kevin |
|
Hi Kevin,
Sorry for getting back to you this late, I've tried with and without the 3rd image and the screenshot below shows what i get when i run it as just T1.  Thank you, Brandon |
|
Hi Brandon,
Please try rerunning you images with builds from here. Are you on windows or linux? It also looks like you don't have any curves enabled in the Y-Data panel, could you also try enabling a curve (you may need to specify x and y data for it). Kevin |
|
Hi Kevin,
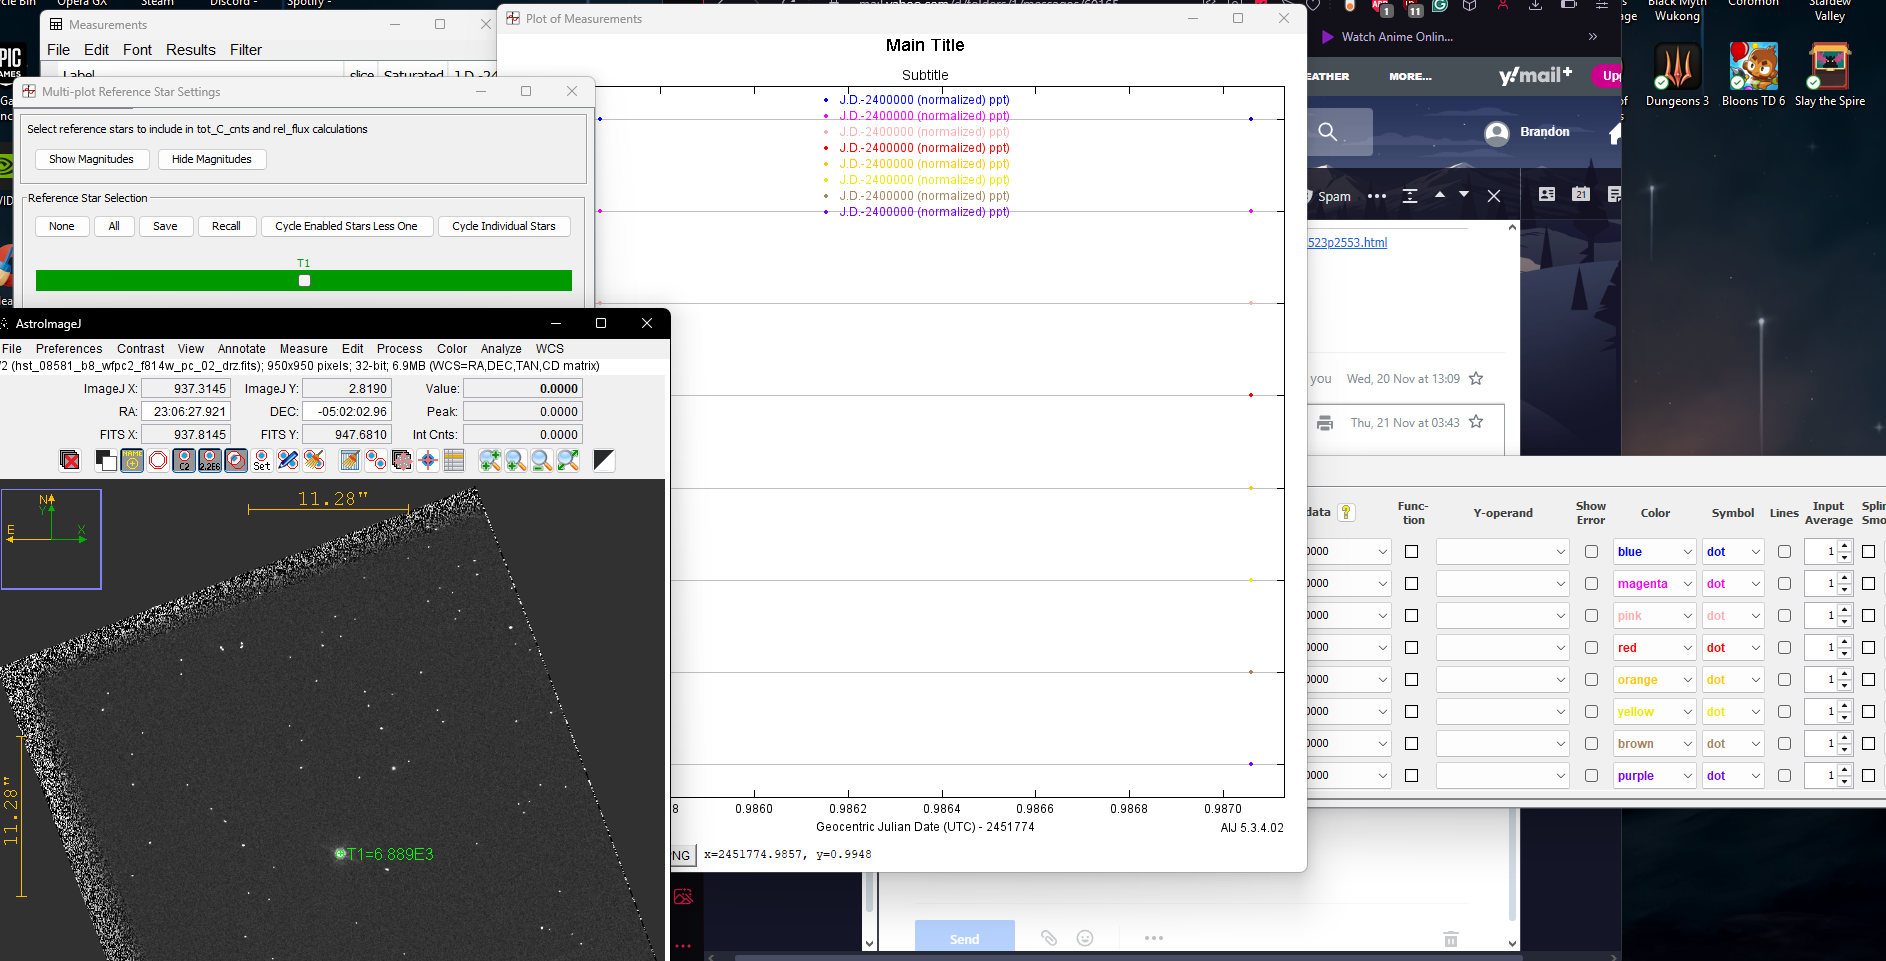
Im on windows and have re-downloaded AIJ from the link you sent, I've also set the y-data and x-data to be the same format and it just seems to plot 1 point from the screenshot below, I'm not sure what could be wrong. Does it work from your end perfectly fine? Thank you, Brandon 
|
|
Hi Brandon,
It looks like you've set the x and y data columns and all 8 curves to show JD-2400000. For one aperture, you'll likely want at least one curve to have its y-data set to Source-Sky_T1. As for there being one point, I can't tell how many images you have open, but multiaperture will add one row to the table for every slice it processes. On the left side of the plot window, I see other points plotted. How many images were in the stack? Kevin |
|
Hi Kevin,
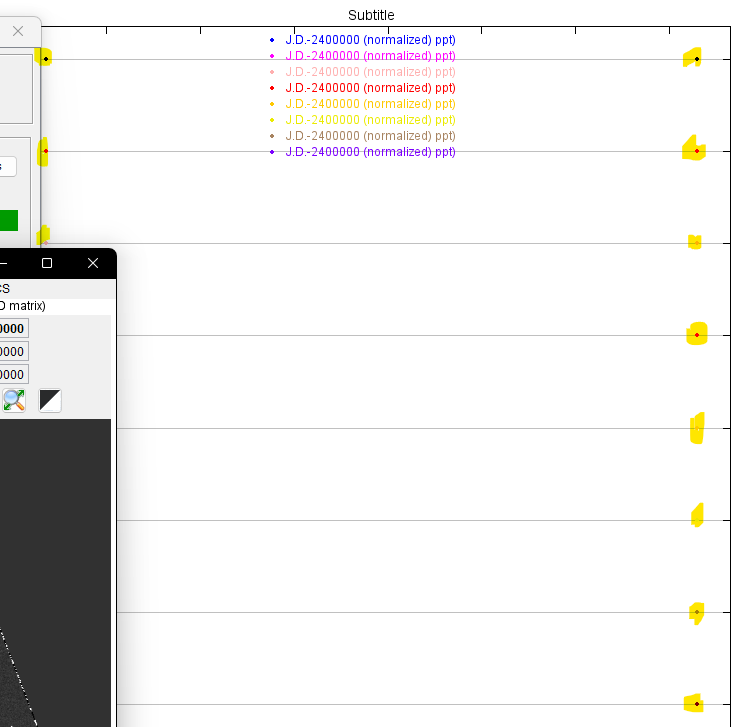
The screenshot below shows the files im using, its only 2 so not much data, could this be a reason its not plotting right? I've tried changing one of them to the source-sky_T1, but it also just plots 1 point at a different area to the other points, I've also tried to change them all to the source-sky_T1, but it doesn't change really. Brandon 
|
|
I see two data points in the plot window you showed.
 Kevin |
|
I'm not too sure what to do with them, to be honest, I'm still new to this, followed youtube videos and not seen anyone get what I've got, they tend to get the lightcurve almost immediately, so I'm confused.
Brandon |
Re: astroimagej Error when plotting
|
Administrator
|
Hi Brandon,
If you want to have a proper lightcurve to work with, you'll of course need more that two images (generally something like 100 or more). Have you tried going through the tutorial (with provided datasets) offered by Dennis Conti at https://www.astrodennis.com? That seems to be the best way for newcomers to come up to speed. Karen |
|
Ah okay, that makes a lot sense, I've not seen the tutorial, are the datasets using tess or kepler data? I've been trying to use a python package called transitfit to perform analyse on the transit and then further spectra analyse using the telescopes filter profiles. I'm assuming the best place to find the datasets I need would be on exoMAST?
Thanks, Brandon |
«
Return to How to accomplish specific tasks in AstroImageJ
|
1 view|%1 views
| Free forum by Nabble | Edit this page |

