Transit Fitting plus referencing software in paper


|
Hello,
Regarding the transit fitting routine, will there be posted a guide on how to use it as I have need to use the routine. I was not able to find it in multiplot. Also is it based on the Mandel and Agol (2002) algorithm ? I am writing a paper, is there a reference paper for Astro Image J and is there also a statement I should use in the Acknowledgements ? Thanks David |
Re: Transit Fitting plus referencing software in paper
|
Administrator
|
Hi David,
Yes, the transit fitting algorithm uses the Mandel and Agol (2002) algorithm. There is currently no paper to reference, but you can reference either Karen Collins & John Kielkopf, 2015, in prep, or you can reference the Astrophysics Source Code Library entry ascl:1309.001 (http://ascl.net/1309.001) (Bibcode: 2013ascl.soft09001C). Unfortunately, there is currently no written guide for the use of the transit fitting routine in AIJ. Hopefully, updates to the guide will happen over over the next several weeks. To get you started for now, you can access the feature by going to the Multi-plot Y-data panel and selecting the bottom most "Fit mode" (looks like a transit light curve):  That will cause the fitting setup panel to open for that light curve. Here is an example setup for a WASP-12b observation: 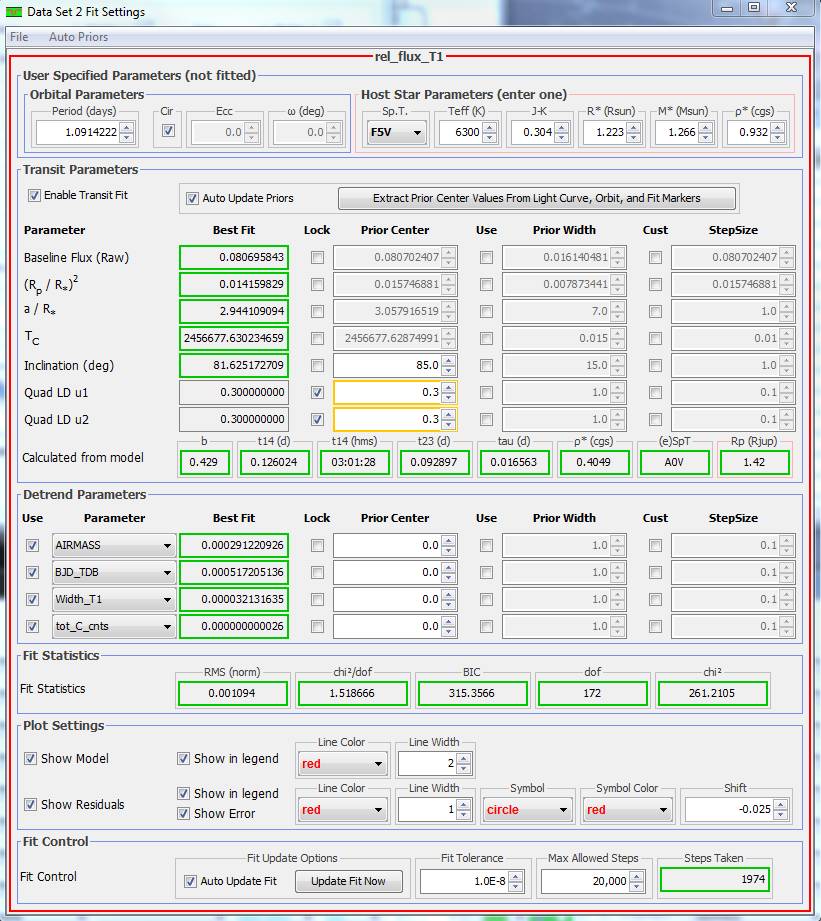 As long as "Auto update Priors" is selected (the default), you really only need to enter the orbital period at the top left of the fit setup panel, and on the bottom row of the 'Multi-plot Main' panel, set the "Fit and Normalize Region Selection" 'Left' setting near the ingress time on the plot (shortcut is <Cntrl>-left-click on the plot), and the 'Right' setting near the egress time (shortcut is <Cntrl>-right-click on the plot). Then select any desired detrending parameters below the fit parameters. The fit will work in most cases with only those settings. The only remaining information that can help to pinpoint the fit is the starting point (or 'Prior Center' setting) for the Quad LD u1 and u2 parameters (i.e. quad limb darkening parameters). If you don't have spectroscopic data for the host star (Teff, [Fe/H] and logg), for ground based data, it is probably good enough to 'lock' both prior center values of u1 and u2 to 0.3 (or maybe lock one of them to 0.3 and the other to 0.0). You may also try unlocking one of them to see what the fit finds. If you have the three spectroscopic parameters mentioned above , use the web site below to calculate theoretical values to use for u1 and u2 based on the filter used for the observations. http://astroutils.astronomy.ohio-state.edu/exofast/limbdark.shtml If your transit is a known exoplanet, look at http://exoplanets.org to find the spectroscopic parameters to use on the above webpage. For ground-based data, it is probably best to lock u1 and u2 to the theoretical values from the webpage, but you can always unlock one or both to see if the fit improves significantly. If one of the values runs away to something near 1.0 or -1.0, you should probably lock that value to the theoretical value. If you want to have the planetary radius estimated, you will need to enter one of the "Host Star Parameters' at the top right of the fit setup panel. The best estimate will be provided in the Rp (Rjup) box if you can find an estimate for host star radius (R*) and enter that directly in the 'Host Star Parameters'. Prior Width and Step Size are advanced settings and are not normally needed, especially for full transit observations. Also, make sure the "Show Tooltips Help' option is enabled on the 'Multi-plot Main' panel 'Preferences' menu while you are becoming familiar with the tool. When that option is enabled, most options on the fit setup panel show additional information in a popup that shows when mousing over any settings box. Let me know if you have specific questions and I will try to answer them here. Here is a plot generated for the WASP-12b example given above: 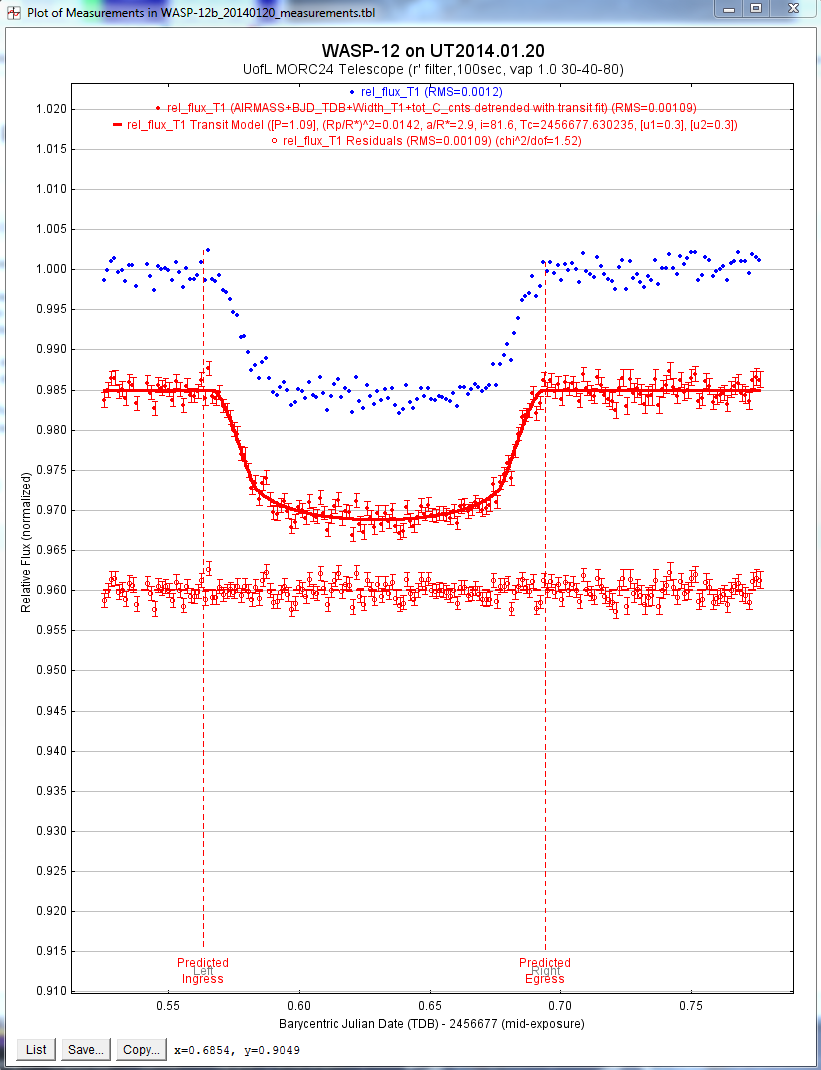 and the associated Multi-plot Main and Multiplot Y-date settings: 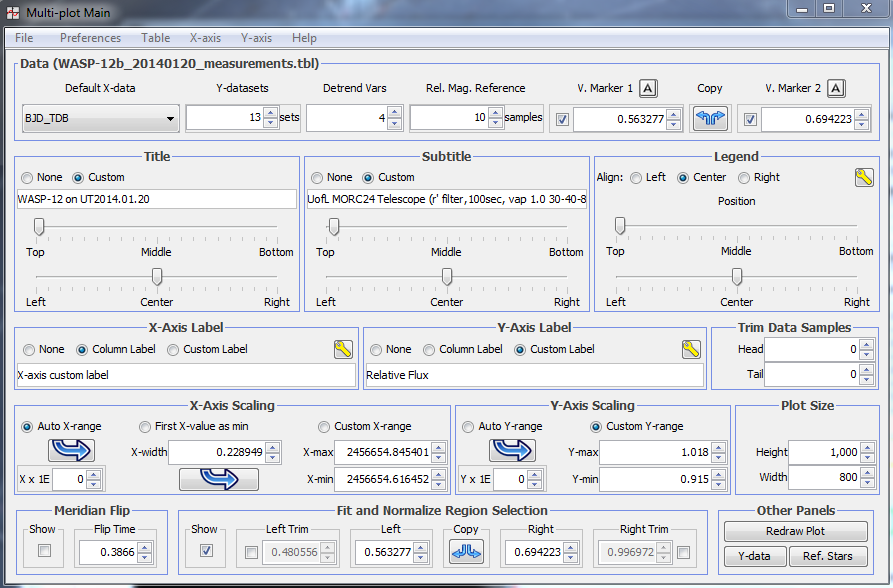  Karen |
|
|
In reply to this post by David
Hi Karen,
Many thanks for your quick response. One other question, is it possible to fit a partial transit say if one has an egress and roughly half of the flat bottom part ? cheers David |
Re: Transit Fitting plus referencing software in paper
|
Administrator
|
Yes, the AIJ fitting panel is designed to be useful for fitting partial
transits as well. As a disclaimer, it is sometimes difficult to extract precise system parameters from partial transits. It helps to know the expected transit ingress and egress times (i.e. Tc and the duration). If these values (and the orbital period) are known, the prior center value of a*/R* can be set to 'lock' and then the value adjusted until the transit duration matches the expected value. For partial transits, locking u1 and u2 to theoretical values will help a transit fit to converge to a reasonable model. Reducing detrending variables can also help partial transit fits to converge to a reasonable model. With too many detrending values, the light curve may prefer a ~flat model instead of a transiting exoplanet model. It might be best to start with no detrending or airmass only detrending for partial transit observations. The 'Prior Width' setting can be used to limit the range of a particular parameter when the best fit is found (click 'Use' next to the box to enable user input). For instance, if there is prior information to suggest the the transit depth should be 1%, a reasonable approach might be to set the prior center value of (Rp/R*)^2 to 0.010 (but not locked), and then set the prior width to some value (say 0.003, which would limit the depth range from 0.7% to 1.3%). To set a specific prior center value for Baseline flux, (Rp/R*)^2, a/R*, or Tc, either disable 'Auto Update Priors' which will enable all 4 boxes for user entered setting for each of the parameters, or leave 'Auto Update Priors' enabled and deselect one or more items in the 'Auto Priors' menu to allow a user setting for individual parameters (i.e. this disables the auto setting that is estimated from the light curve data and allows the user to enter the value). Karen |
|
|
Hi Karen,
Thanks again for your reply. Tried the transit and fitting. We have good estimates for the host star parameters so when I put in the value for R, the other parameters (M, Teff, ect) are up to 30% off from the true values. Is there a way to lock in these values independently of those given by the model used by the software. Also, if the baseline on either side of the transit are not level, one has to detrend first ? That is if one has something like this: --------- \ \ - -------------- \ / \--------- Thanks Again, David |
Re: Transit Fitting plus referencing software in paper
|
Administrator
|
Hi David,
The host star parameters shown in the fit panel are tied together by tables from Allen's Astronomical Quantities 4th edition for "normal" main sequence stars. There is currently no way to unlock the relationship between the host star parameter values. The only value that is really used to calculate the planet radius (Rp) is R*. If you know R*, enter it directly and ignore the other values. The other values will not affect the calculation of Rp. Entry of the other values is allowed simply to provide an estimate of R* from any one of the other spectroscopic or photometric parameters in the case where R* is not known. Generally, the first suspect in light curves that show a trend is airmass. I would try detrending with airmass along with the transit fit. A second choice would be whatever you use for you time base (i.e. JD_UTC, etc). It is hard to know beyond that without seeing the actual data. If you would like for me to suggest specific settings for a transit dataset you have, you can send the measurements table and plot config file to me at (~~~karenacollins~~~@~~~outlookDOTcom). The data would be kept private, and I could send you a suggested setup with an explanation of any unusual settings. Karen |
|
|
Hi Karen,
Thanks again and I will email you over the next day or so. Best David |
|
|
Hi Karen,
I tried using the transit fitting algorithm to a transit light curve I got elsewhere that also had uncertainties for the relative flux, but got an error message stating there were counts in the file. Is there a way to still use the algorithm ? Thanks, David |
|
|
I'm sorry, the software said there no counts.
|
Re: Transit Fitting plus referencing software in paper
|
Administrator
|
In reply to this post by David
Hi David,
Yes, you should be able to fit a light curve from any source. Can you expand on the the error message "counts in the file". A screen grab of the error message would be ideal. I don't recognize that one. Alternatively, could you send me the data file and let me know which columns you are using for time, flux, and error, so I could see the problem myself? You can send it directly to karenacollins (~~~at***) outlook (dot.dot) com if you prefer. Karen |
|
|
Hi Karen,
Email sent via my yahoo account. Thanks, David |
Re: Transit Fitting plus referencing software in paper
|
Administrator
|
Hi David,
Thank you for sending your data to me separately. Hopefully the example plot and plotcfg files I returned are useful to help understand how to plot and fit externally generated light curves. For the benefit of others on the support forum, I will review some of my feedback to you here. I think the main thing that caused trouble is that the data columns in the table are not labeled. While it is technically possible to use the unlabeled default names of col_1, col_2, etc., it makes life a lot easier in AIJ if you label the columns with names that AIJ uses internally and handles more gracefully. Standard AIJ column names are described at Multi-plot_Main->Help->'Data naming convention...'. The first line in a data file is used to define the labels. Use the same seperator as used in the data part of the file to separate the headers. The header line may be started with a hashtag (#) to indicate a comment line, or can simply start with the data column names. Here is an example of a data column name line for a comma separated data table: JD_UTC,rel_flux_T1,rel_flux_err_T1 Tab delimited files are generated by AIJ as output, so <tabs> may be used in place of the commas in the above line. Spaces may also be used as column separators. In any case, the same separator used in the data lines should also be used in the column header line. A common problem plotting data generated externally is that AIJ only understands certain column names as time columns and subtracts off the very large JD base numbers to create a proper plot with readable numbers. The under the hood problem is that the plots in ImageJ (which AIJ is based on of course) only handle 32-bit floating point numbers instead of the 64-bit floating point numbers required to handle the very large JD numbers. The way around that problem is to subtract off the JD base and show it in the x-axis label below the plot. AIJ will do that automatically as long the time column label contains JD or J.D. in the column name in the first line of the table file. The second reason to label columns with standard AIJ names is so that an error column can be associated with its corresponding data column by simply enabling the "Auto Error" option. However, this can be worked around if desired by using the "Function" operation "Custom Error" on the Multi-plot Y-data panel and then manually specifying the appropriate error column in the Y-operand selector. Karen |
|
|
Hi Karen,
A couple of additional questions. Sometimes I have had to reduce a light curve in two sections because of the rotation of the camera which can't be taken care of by aligning all the frames first. I notices that I can do the reduction in one go, if I also before setting the aperture on the target and calibrators, set the position by the coordinates that the aperture is centered on. Is there any reason to suppose that the two results may be different ? I can see the algorithm in the first case centering itself on the centroid of the stellar image which may be different than in the second case where the user centers the aperture on the user perceived centroid and the algorithm uses the position of the position for subsequent frames. Now throughout the night, the centroid position may change and while the first method can takes this into account, the second method relying on coordinates cannot. This may matter for someone trying to get a transit light curve with the highest possible precision. Am I correct here ? In general also, if one has two telescopes observing a target simultaneously, how one combine the light curves ? I see there is an "append" option in multi-plot so maybe this is used ? Thanks Again, David |
Re: Transit Fitting plus referencing software in paper
|
Administrator
|
Hi David,
You should get the same result with both methods (after combining in the first case). In the second case, if you enable "Use RA/Dec to locate aperture positions" and also enable "Reposition aperture to object centroid", the centroid operation still occurs based on the starting point as defined by aperture's RA/DEC location (so the aperture should still find the star's center). If you are getting different results, send me more details to investigate. If you are observing exoplanet transits and are fitting the data to a transit model in Multi-Plot, but sure and include the "meridian flip" detrend parameter and place the 'meridian Flip' 'Flip Time' at the time of the meridian flip (controlled on lower-left of the Multi-plot Main panel). This will model out any offset induced by the different positions of stars on the CCD. Yes, the append option is intended to combine two sets of data into one measurements table /plot. For your case, you should use 'Append as new ROWS' to create a single dataset. If you are combining datasets to plot more that one light curve, use 'Append as new COLUMNS' so that each of the data columns in the two data sets will have a suffix appended to the data column names (such as _A and _B (use something short)) which will facilitate plotting the datasets with independent X and Y columns as needed. By the way, if you are combining data before and after a meridian flip, you should use the same comp star ensemble in both photometry runs (and same aperture settings). in other words, if a comp star is on the detector before meridian flip and not after, don't use it in either case. Karen |
|
|
Hi Karen,
Thanks for your reply. The meridian flip occurs about two thirds through a transit and the difference is that there is a "wiggle" just at the end of the transit when I don't use the coordinates option and hence do the light curve in two sections while the "wiggle" is absent when I use the coordinate option and so reduce the light curve in one go. Regardless, I take it that the "meridian flip" detrend parameter should still be activated regardless when the flip occurs ? Thanks Again David |
Re: Transit Fitting plus referencing software in paper
|
Administrator
|
Hi David, I'm not sure what to make of the difference of the wiggle between the two methods, but it seems that "coordinate option" with "centroid" enabled is the easiest way to go if your images have WCS headers (i.e. have been plate solved). That saves having to merge the two measurements tables. Yes, when a meridian flip physically occurred during observations, the meridian flip detrend parameter should be enabled when fitting a light curve model, especially if there is an offset in the relative flux at the flip time in observations. It doesn't matter when the flip occurs, but you must place the meridian flip marker at a time between the last exposure in the east and the first exposure in the west. Karen |
|
|
Hi Karen,
A couple of quick questions: In exoplanet transit fitting, suppose we know the radius and spectral type of a star but the radius differs for the value given for that spectral type by astro image J, would this lead to an incorrect value for the modeled transit duration, impact parameter b and inclination angle ? Or it only matters that the actual radius is not too different from the value that astro image J uses ? For the latter what would count as "not too different" ? For the WASP 12 example that you gave, could you outline the way you detrended the light curves as it is not completely clear in the figures. i also see that you detrended the comparison stars too. Regarding detrending by using "meridian flip", could one use this option if there was a break in observing ? For I see that one of my light curves shows a break of ~5 minutes and when the observing resumed, I see that at least one of the comparison stars is offset from the values from before the break. Thanks David |
Re: Transit Fitting plus referencing software in paper
|
Administrator
|
Hi David,
The 'Host Star Parameters' on the AIJ fit panel are used only to estimate the actual planet radius, 'Rp (Rjup)', when combined with the value of (Rp/R*)^2 from the light curve model fit. The only parameter that is actually used in the calculation is 'R* (Rsun)'. So, if you have prior knowledge of 'R* (Rsun)', then enter that number directly and ignore all of the other host star parameter values that show up. The other host star values will not affect the determination of the actual planet radius or anything else about the transit model. Entering one of the other values is useful only if R* is not known directly. These values are all tied together based on tables in Allen's Astrophysical Quantities, 4th edition. The connection between the values is only a very rough estimate which is valid only for "Normal" main sequence stars (as defined in Allen's Astrophysical Quantities). As an example, if the only prior information that is known about the host star is the J-K color, enter that value in the corresponding box, and the corresponding value of R* from the Allen's tables will be displayed in the 'R* (Rsun)' box and that value of R* will be used to calculate Rp. Just to clarify, the host star parameters, and in particular 'R* (Rsun)' (either entered direct or estimated from one of the other host star parameters) are not used at all in the light curve model fit. The only way that the resulting 'R* (Rsun)' value is used is to calculate 'Rp (Rjup)' that is displayed in the lower-right corner of the 'Transit Parameters'. For your case, enter R* directly and ignore the other host star parameters. They other parameters will not affect the light curve model fit in any way. 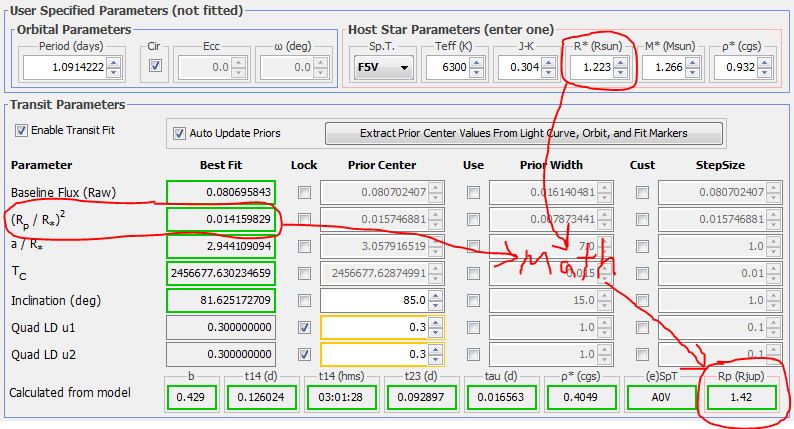 Detrending requires a little experimentation with your data, and will become easier once you understand what trend parameters tend to affect your data. In the fit example I showed previously, airmass, time (BJD_TDB), FWHM in the image (Width_T1), and total comparison star counts (tot_C_Cnts) were used for detrending. Normally four detrend parameters is too many, but that light curve has good out-of-transit baseline data on both side of the transit. One or two detrend parameters is usually more appropriate. Airmass is generally the most important parameter to use for detrending since it affects all observations for which the target and comparison stars are not of the same color (and they are generally not of the same color). If you use more than airmass as a detrending parameter, you will generally need good pre-ingress and post-egress baseline data. If you don't have good baseline line on both sides of the transit, using multiple detrend parameters will likely modify the light curve inappropriately. For partial transits, even airmass as a single detrending parameter can introduce more problems in the light curve than it corrects. Detrending using your time base column can remove a linear trend in time from the light curve (for instance if the host star or one of the comparison stars is actually changing brightness slowly throughout the transit). I have found that changes in FWHM from image to image also introduces noise in the light curve that can often be detrended out of the data if good baseline data are available. Finally, detrending with total comparison star counts sometimes reduces systematics in data, particularly if your target and comparison stars are not of equal brightness, and particularly if you don't correct for CCD non-linearity as part of the data calibration process. It is tempting to throw a bunch of detrending parameters at your light curves to make them as clean as possible. However, multiple detrending varaibles can combine to cause undesirable effects in the data (over fitting). So, it is best to find a good balance between adding more detrending parameters and retaining the integrity of the data. One way to approach that is to observe the Bayesian Information Criterion (BIC) value, which is circled in the figure below. You can read about the details of BIC on Wikipedia if you interested. The main thing you need to know is that if the BIC value reduces by more than 2.0 when a new detrend parameter is added, you might consider keeping that detrend parameter. If the BIC value reduces by less than 2.0 or increases, then that detrending parameter is likely not appropriate to keep as part of the fit. I normally apply an airmass detrend to the comp stars for display purposes to help gauge if they are flat after airmass detrending. If you are fitting rel_flux_Txx though, the displayed detrending of the comp star does not actually affect the target star light curve or model fit. Only detrending of the target star light curve affects its model fit. Meridian flip detrending can be used any time there is a discontinuity in the data. For instance, if you lose guiding and then regain guiding and the field is positioned differently on the CCD, then Meridian flip detrending might be appropriate. Meridian flip detrending allows for an arbitrary offset in the light curve at the marked "meridian flip" time, so unless you have good out-of-transit data, Meridian flip detrending can definitely introduce unwanted effects in the light curve. So, only use Meridian flip detrending if you suspect that there is an offset in the lightcurve at the discontinuity in the data (i.e. an instantaneous increase or decrease in the light curve from before and after the discontinuity), and if you have good out-of-transit data. In general, lots of out-of-transit data make detrending much more effective and reduces the chance that detrending will incorrectly modify your light curve and light curve model fit. 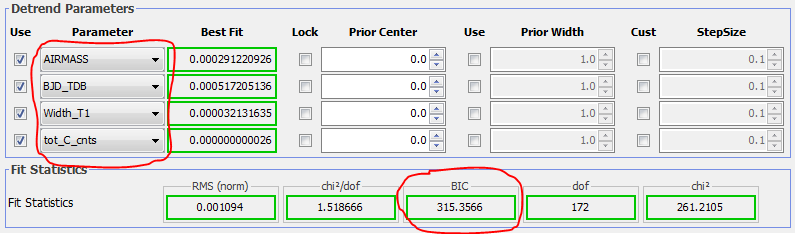 Karen |
|
|
Hi Karen,
Sorry I forgot one question which is when giving the values from the transit fitting (Rp/R*, inclination angle, ect.), should one simply use the RMS for the uncertainties in the fitted values ? Doing this of course ignores any red noise, but I imagine it would be hard to account for it anyway. Many Thanks Again, David |
Re: Transit Fitting plus referencing software in paper
|
Administrator
|
Hi David,
This is an important question for data you are planning to publish. At this time, AIJ only finds the best fit values for the model parameters. It does not find error for each of those model parameters. That is best done by a technique called Markov Chain Monte Carlo (MCMC). Wikipedia has an article on MCMC if you are not familiar with the concept. I plan to add that capability to AIJ down the road, but it will not happen for about another year. In the mean time, there is a free web-based tool (EXOFAST) that will provide that capability using input from AIJ. The website is here: http://astroutils.astronomy.ohio-state.edu/exofast/exofast.shtml Instructions for the use of that tool are provided by the authors at the website. First you would want to find the best fit model in AIJ, primarily to determine which detrending parameters you want to include in the final fit, and for partial or otherwise tricky light curves, you may need to include some model parameter 'Priors' on the webpage form that you can read off of the AIJ fit panel (i.e. the best fit model parameters shown in AIJ). Using Multi-plot->File->Save data subset, save the following columns in the order indicated: BJD_TDB (time) rel_flux_T1_n (normalized relative flux - NOT detrended) rel_flux_err_T1_n (normalized relative flux error) detrend param 1 detrend param 2 ... detrend param n You should use BJD_TDB as your time base. If you don't have that format in your fits headers, or didn't extract that into the measurements table, you can great BJD_TDB in AIJ using your object coordinates, observatory geographic location,a nd the JD_UTC times in the measurements table (either J.D.-240000 or JD_UTC). See this post at the support forum to help in creating BJD_TDB: http://astroimagej.1065399.n5.nabble.com/Add-new-astronomical-values-such-as-BJD-TDB-AIRMASS-etc-to-an-exisiting-measurements-table-td91.html The astronomical data calculation interface has changed slightly since that post, but not so much as to invalidate those instructions. Once you have plotted normalized rel_flux_T1 (assuming your target is T1), you need to save the plotted values back to the measurements table by clicking the 'New Col' icon (  ) on the left
side of the associated plot row. ) on the left
side of the associated plot row.Then you can use Multi-plot->File->Save data subset to save the data listed above to a text file that you can open in a text editor and then copy and paste into the photometry side of the EXOFAST webpage interface. Karen |
«
Return to AstroImageJ
|
1 view|%1 views
| Free forum by Nabble | Edit this page |