Loading... |
Reply to author |
Edit post |
Move post |
Delete this post |
Delete this post and replies |
Change post date |
Print post |
Permalink |
Raw mail |
anyone know why my data results in a straight line transit fit?
data looks like i should have a decent light curve but for some reason i just get a straight line...? thanks gavin ![]() ![]() |
Loading... |
Reply to author |
Edit post |
Move post |
Delete this post |
Delete this post and replies |
Change post date |
Print post |
Permalink |
Raw mail |
Administrator
|
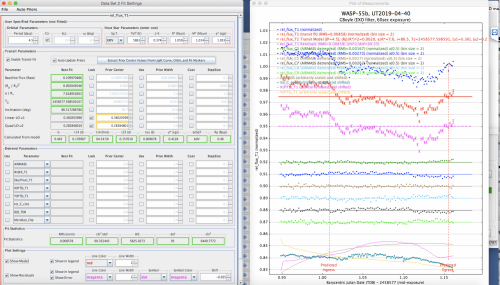
The "left" and "right" markers on Multi-plot Main should be set to the approximate apparent time of start of ingress (t0) and end of egress (t4), respectively. In other words, make sure they are set similar to your predicted ingress and egress markers in this
case (those two are for display purposes only to mark the predicted times, rather than the actual apparent times). Also, it looks like you have an airmass trend, so I would add airmass detrending to the model.
If that doesn't do the trick, let us know. Karen On 4/5/2019 7:14 AM, gboyle [via AstroImageJ] wrote:
anyone know why my data results in a straight line transit fit? |
Loading... |
Reply to author |
Edit post |
Move post |
Delete this post |
Delete this post and replies |
Change post date |
Print post |
Permalink |
Raw mail |
Thanks Karen
I am a total idiot and you , as ever, are very kind!! That did the trick!! Best Gavin Sent from my iPad
... [show rest of quote] |
Free forum by Nabble | Edit this page |