Re: Plot seeing profile
URL: http://astroimagej.170.s1.nabble.com/Plot-seeing-profile-tp727p728.html
Hi Guy,
1) On my machine, the x-axis is indeed labeled as Radius [pixels]. An example is shown below. Could you post an example from your machine that shows inches? Which version of AIJ are you running? What clicks or menu items did you use to initiate the Seeing
Profile plot?
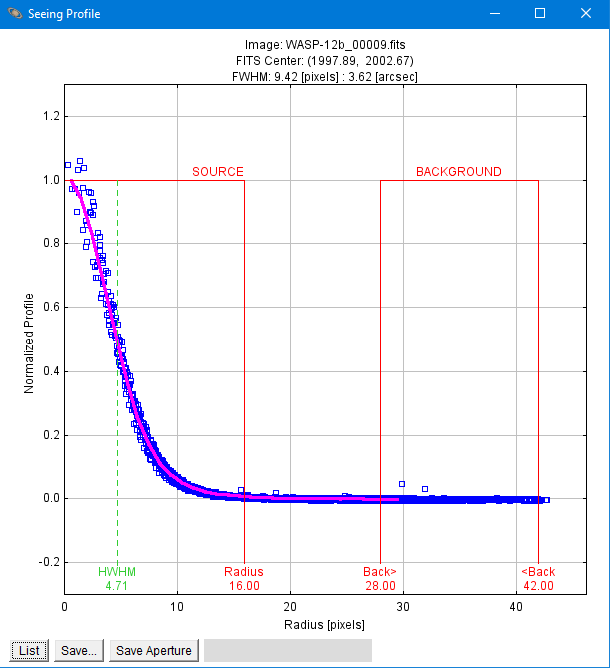
2) This is discussed in appendix A.4 in the paper. HWHM is just FWHM/2. HWHM is just the x-axis point where the magenta line crosses 0.5 on the y-axis. Radius is 1.7 x FWHM, Back> is 1.9 x FWHM,, <Back is 2.55 x FWHM. These radii give an equal number of pixels in the aperture and sky-background annulus. The magenta curve is not actually a fit. To draw the line, AIJ first bins all of the radial measurements into one pixel wide bins. Then line segments are drawn from each binned point to the next to create the overall magenta curve.
3) Yes, click the "List" button at the bottom left of the plot. The blue points are in columns X0, Y0. The points that define the magenta line are in columns X1, Y1.
| Free forum by Nabble | Edit this page |