Re: How to save a live surface plot profile?
Posted by chrismlt on Apr 23, 2016; 10:18am
URL: http://astroimagej.170.s1.nabble.com/How-to-save-a-live-surface-plot-profile-tp382p391.html
Thomas,
Here are the results I get using AIJ to extract photometric data, and then Period04 to extract a possible period in the data - if any.
As the found period are not matching the results you posted here previously, this is to be taken with some caution. Nevertheless, this may be convincing at first sight.
To extract photometry, I compared the satellite brightness to the bright star visible in the lower left corner of the image.
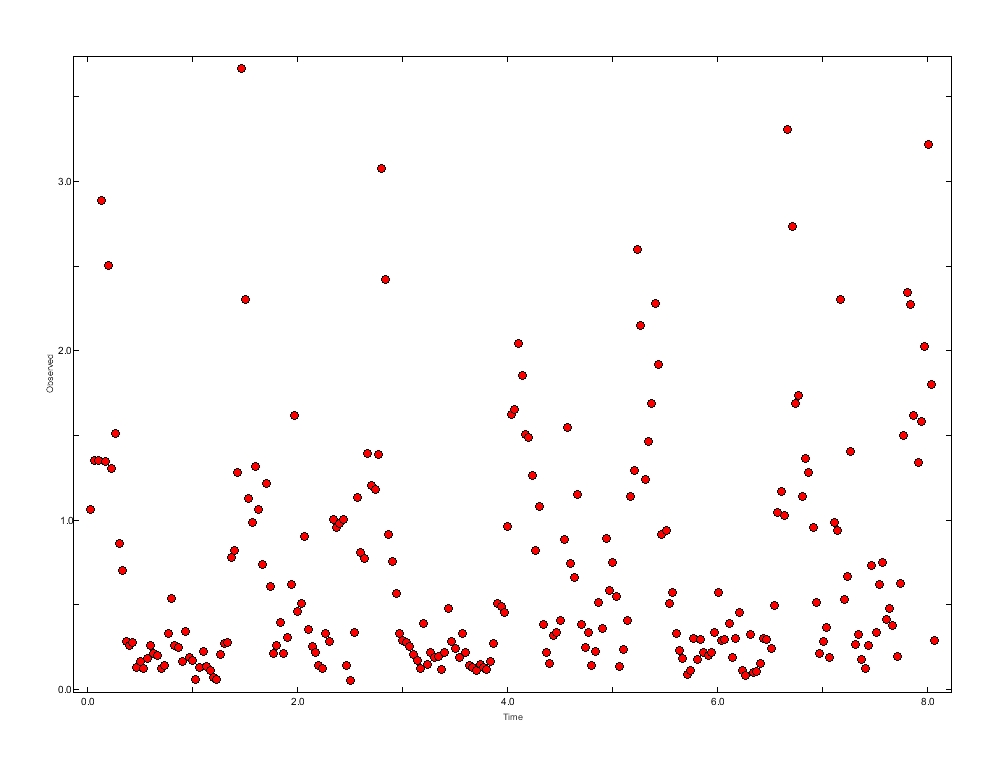
The brightness is in relative flux to the star flux, which is 1, by convention.
Please note that : the satellite brightness sometimes droped to a level very near 0, so the bottom of the light curve is somewhat noisy. And : some of the brightest images of the satellite are partially saturated, so the satellite brightness could be sometimes more elevated that it appears here.
Also, the last 20 images of the avi were not usable because the satellite was near the edge ; there remains only 242 images to be measured.
At first sight, a period near 1 second seems visible from the raw curve.
Using Period04, two periods seems to emerge at a level of confidence :
(Below F1 and F2 are frequencies ; first col = freq , sec col = amplitude , third col = phase ; residual are in amplitude = most of the scintillation noise, presumably at first sight)
F1 0.769059429465814 0.541805937197838 0.104171144385021
F2 1.54564613145243 0.442123765492428 0.96015439054003
Residuals = 0.481029316
Here are the graph showing the two imbricated periods :
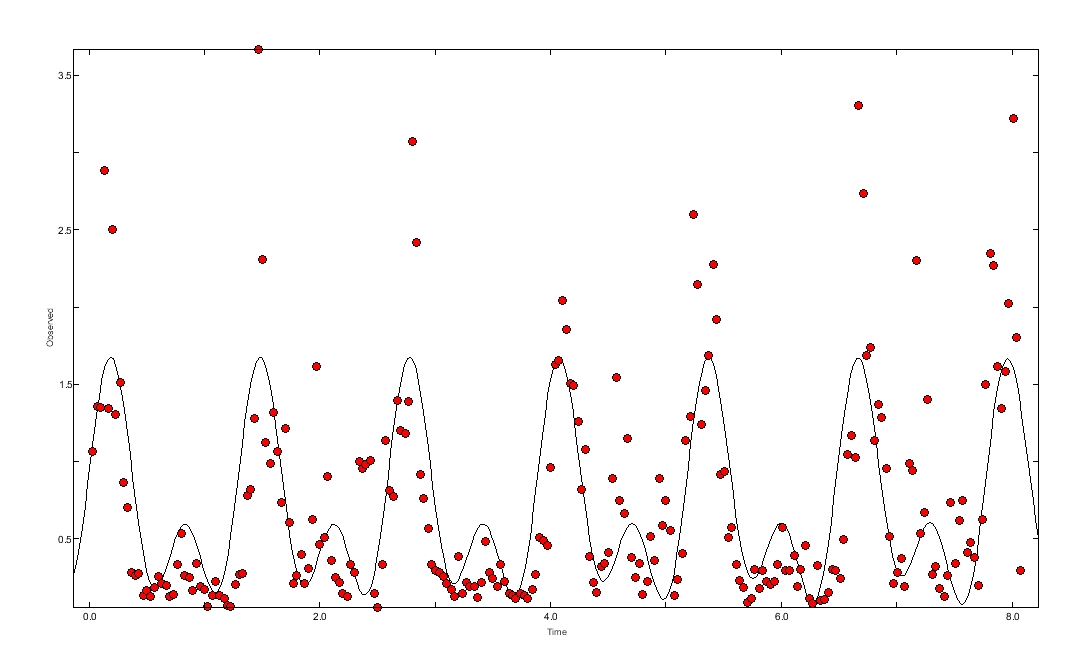
Period04 is not always as good as needed to derive amplitudes, so be cautious with this.
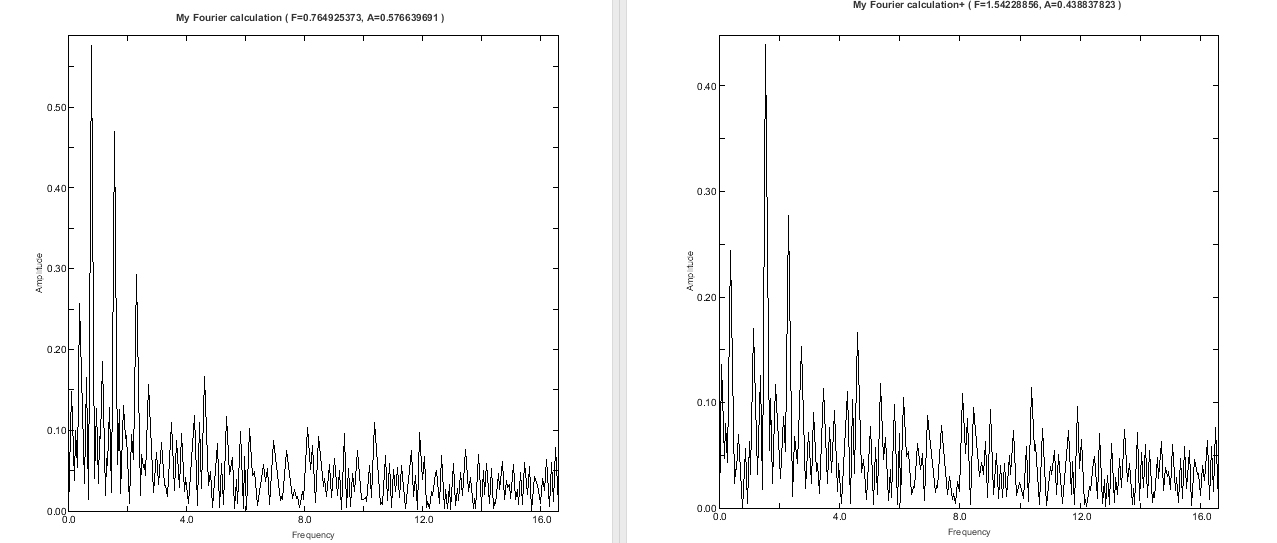
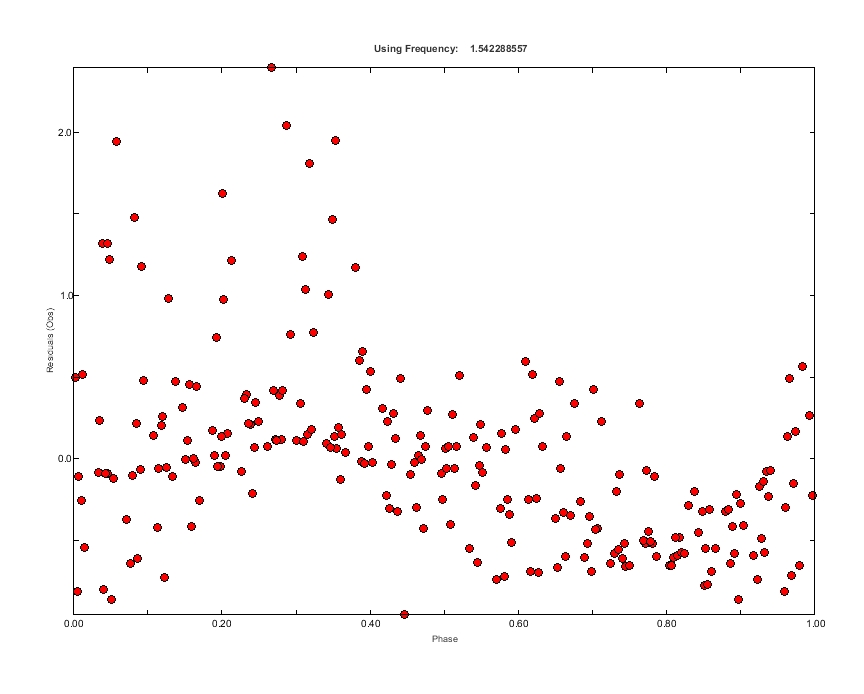
Now : here are the Fourier graphs showing the used peaks in the analyze , and the phase plot.
As you can see, the plot is not totally convincing, as the residuals are somewhat dispersed. Going further is this analyze seems not to be feasible as there is not enough data, I think. Well, maybe not ;-)
About the scintillation : as anyone can see from your video, the main period (the one that brings the satellite from dark to brightness) is evidently not due to the atmopheric scintillation.
To evaluate the real impact of the atmospheric scintillation we need to know more detail about the video :
specially what was the altitude of the satellite when the images were taken. What was the estimated magnitude of the satellite, and what was the used gear (telescope/camera).
Now, really, I do not think scintillation is a real issue here, as the scintillation is probably no more than a few percent of the variation (this can be derived from the comparison star, if needed). More : some noise seems to be due to the file format (compression).
Two more thinking : As there was only 8 seconds of data to analyze, the result is very partial. It could be greatly improved by adding more images, if you have some.
The period as shown here is probably only a part of the reality : should the satellite be impacted by something, the satellite is possibly spinning around 3 axes, with more than 2 periods ...
Now, the freq 2 is almost double as freq 1, so it may be that there is only one rotation period, with two flashes during one rotation.
Well, I hope this will help ; and you get the result before the monsoon ;-)
If needed, I can send you the original extracted data ; in this case : please let me know your email adress here and I will contact you privately.
If you have news, I may be pleased to reader further on this case, so post here, please!
Christophe
URL: http://astroimagej.170.s1.nabble.com/How-to-save-a-live-surface-plot-profile-tp382p391.html
Thomas,
Here are the results I get using AIJ to extract photometric data, and then Period04 to extract a possible period in the data - if any.
As the found period are not matching the results you posted here previously, this is to be taken with some caution. Nevertheless, this may be convincing at first sight.
To extract photometry, I compared the satellite brightness to the bright star visible in the lower left corner of the image.
The brightness is in relative flux to the star flux, which is 1, by convention.
Please note that : the satellite brightness sometimes droped to a level very near 0, so the bottom of the light curve is somewhat noisy. And : some of the brightest images of the satellite are partially saturated, so the satellite brightness could be sometimes more elevated that it appears here.
Also, the last 20 images of the avi were not usable because the satellite was near the edge ; there remains only 242 images to be measured.
At first sight, a period near 1 second seems visible from the raw curve.
Using Period04, two periods seems to emerge at a level of confidence :
(Below F1 and F2 are frequencies ; first col = freq , sec col = amplitude , third col = phase ; residual are in amplitude = most of the scintillation noise, presumably at first sight)
F1 0.769059429465814 0.541805937197838 0.104171144385021
F2 1.54564613145243 0.442123765492428 0.96015439054003
Residuals = 0.481029316
Here are the graph showing the two imbricated periods :
Period04 is not always as good as needed to derive amplitudes, so be cautious with this.
Now : here are the Fourier graphs showing the used peaks in the analyze , and the phase plot.
As you can see, the plot is not totally convincing, as the residuals are somewhat dispersed. Going further is this analyze seems not to be feasible as there is not enough data, I think. Well, maybe not ;-)
About the scintillation : as anyone can see from your video, the main period (the one that brings the satellite from dark to brightness) is evidently not due to the atmopheric scintillation.
To evaluate the real impact of the atmospheric scintillation we need to know more detail about the video :
specially what was the altitude of the satellite when the images were taken. What was the estimated magnitude of the satellite, and what was the used gear (telescope/camera).
Now, really, I do not think scintillation is a real issue here, as the scintillation is probably no more than a few percent of the variation (this can be derived from the comparison star, if needed). More : some noise seems to be due to the file format (compression).
Two more thinking : As there was only 8 seconds of data to analyze, the result is very partial. It could be greatly improved by adding more images, if you have some.
The period as shown here is probably only a part of the reality : should the satellite be impacted by something, the satellite is possibly spinning around 3 axes, with more than 2 periods ...
Now, the freq 2 is almost double as freq 1, so it may be that there is only one rotation period, with two flashes during one rotation.
Well, I hope this will help ; and you get the result before the monsoon ;-)
If needed, I can send you the original extracted data ; in this case : please let me know your email adress here and I will contact you privately.
If you have news, I may be pleased to reader further on this case, so post here, please!
Christophe
| Free forum by Nabble | Edit this page |