Re: Time stamping videos
Posted by karenacollins on
URL: http://astroimagej.170.s1.nabble.com/Time-stamping-videos-tp311p312.html
Hi Ferran,
Here is a way to add the time values to the measurements table after photometry has been run, if that would work for you:
First, run photometry on the image stack and plot your light curve samples against "sample number" by selecting the "X-data" drop-down menu selection that is blank. Then, on an unused line of the Multi-plot Y-data panel, go to an unused row of plot controls and set it up with "Y-data" set to "blank", all other options on that row off or disabled, set your (base-time MINUS 1*increment) in the "then Shift" box and your increment in "Scale". Here is an example setup for a base time of 2457012.001, with an offset between frames of 0.001 days:
(NOTE: the values will start at 2457012.001 rather than 2457012.000, so you need to subtract off one increment from the base time before entering in the "then Scale" box.)

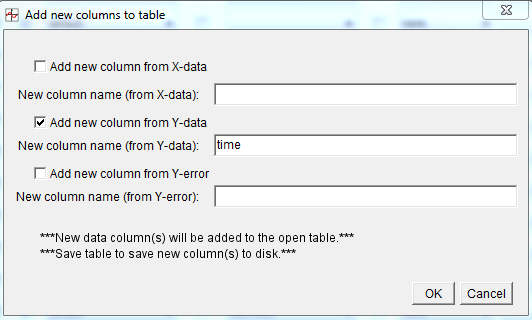
Now click the "New Col" button on the left-hand side of that row. In the panel that opens, enable "Add new column from y-data", and type in your desired data column name. In the example below, I used "time" as the column name. Then click OK. A new column will be added to the table and you can now select that as your X-data column for plotting.
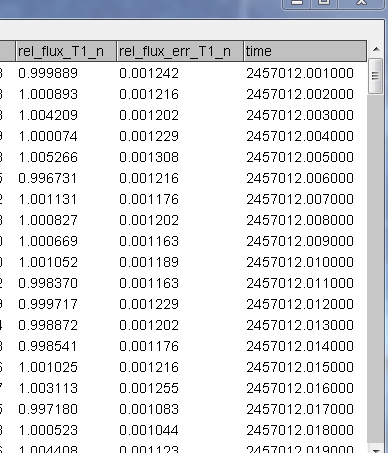
Here is a partial table screen grab showing the new time column:
That is a bit of a work-around, but I think it will be quick once you have done it a couple of times. Is that an acceptable solution for your application?
Karen
URL: http://astroimagej.170.s1.nabble.com/Time-stamping-videos-tp311p312.html
Hi Ferran,
Here is a way to add the time values to the measurements table after photometry has been run, if that would work for you:
First, run photometry on the image stack and plot your light curve samples against "sample number" by selecting the "X-data" drop-down menu selection that is blank. Then, on an unused line of the Multi-plot Y-data panel, go to an unused row of plot controls and set it up with "Y-data" set to "blank", all other options on that row off or disabled, set your (base-time MINUS 1*increment) in the "then Shift" box and your increment in "Scale". Here is an example setup for a base time of 2457012.001, with an offset between frames of 0.001 days:
(NOTE: the values will start at 2457012.001 rather than 2457012.000, so you need to subtract off one increment from the base time before entering in the "then Scale" box.)
Now click the "New Col" button on the left-hand side of that row. In the panel that opens, enable "Add new column from y-data", and type in your desired data column name. In the example below, I used "time" as the column name. Then click OK. A new column will be added to the table and you can now select that as your X-data column for plotting.
Here is a partial table screen grab showing the new time column:
That is a bit of a work-around, but I think it will be quick once you have done it a couple of times. Is that an acceptable solution for your application?
Karen
| Free forum by Nabble | Edit this page |