Re: Multiplot magnitude issue
Posted by karenacollins on
URL: http://astroimagej.170.s1.nabble.com/Multiplot-magnitude-issue-tp267p268.html
Hi, I see that a little confusion has been introduced into some of the GUI labels with the addition of the ability to enter absolute magnitudes. The measurements table column "Source_AMag_T1" is of course already in absolute magnitude, so if you plot it directly (uncheck the "Input In Mag" and "Out Mag" options, disable normalization, disable detrend/fitting - which you have done, set "Scale"=1, and "Then Shift"=0), you should see the absolute magnitude value plotted without the values being changed. I am guessing that these options are deselected/disabled on the computer that is displaying the absolute magnitude values properly.
I'll add more details on the usage of "Input In Mag" and "Out Mag" here:
If "Input In Mag" is selected, the magnitude values in the measurements table column are converted to flux based on the first n data values, where n is defined on the Multi-plot Main panel here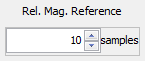 . If a
normalization region has been selected, that full region is used
instead of the first n values. In your example, you have the full
range of data selected in the normalization mode box, so the data
should be centered around zero since you also have "Out Mag"
selected. If "Out Mag" is also selected, the (potential
detrended/fitted/normalized/scaled/shifted) relative flux values are
then converted back to zero-based magnitude, which is what is
happening in your case. So just deselect "Input In Mag" and "Out
Mag" and disabled normalization to see your values display properly.
. If a
normalization region has been selected, that full region is used
instead of the first n values. In your example, you have the full
range of data selected in the normalization mode box, so the data
should be centered around zero since you also have "Out Mag"
selected. If "Out Mag" is also selected, the (potential
detrended/fitted/normalized/scaled/shifted) relative flux values are
then converted back to zero-based magnitude, which is what is
happening in your case. So just deselect "Input In Mag" and "Out
Mag" and disabled normalization to see your values display properly.
Extending Tool Tip Help Display: After a tooltip message is displayed, slowly move the mouse pointer back and forth over the item of interest to keep the message displayed longer. This is fairly easy using a physical mouse, but I imagine it may be more difficult using the trackpad of a laptop.
As another tip, you can save plot setting using the Multi-plot Main "File" menu, send them to another computer, and then load the settings file on the other computer to recreate a plot, if there is ever a question of settings (or if you just want to recreate a plot at a later time).
URL: http://astroimagej.170.s1.nabble.com/Multiplot-magnitude-issue-tp267p268.html
Hi, I see that a little confusion has been introduced into some of the GUI labels with the addition of the ability to enter absolute magnitudes. The measurements table column "Source_AMag_T1" is of course already in absolute magnitude, so if you plot it directly (uncheck the "Input In Mag" and "Out Mag" options, disable normalization, disable detrend/fitting - which you have done, set "Scale"=1, and "Then Shift"=0), you should see the absolute magnitude value plotted without the values being changed. I am guessing that these options are deselected/disabled on the computer that is displaying the absolute magnitude values properly.
I'll add more details on the usage of "Input In Mag" and "Out Mag" here:
If "Input In Mag" is selected, the magnitude values in the measurements table column are converted to flux based on the first n data values, where n is defined on the Multi-plot Main panel here
. If a
normalization region has been selected, that full region is used
instead of the first n values. In your example, you have the full
range of data selected in the normalization mode box, so the data
should be centered around zero since you also have "Out Mag"
selected. If "Out Mag" is also selected, the (potential
detrended/fitted/normalized/scaled/shifted) relative flux values are
then converted back to zero-based magnitude, which is what is
happening in your case. So just deselect "Input In Mag" and "Out
Mag" and disabled normalization to see your values display properly.Extending Tool Tip Help Display: After a tooltip message is displayed, slowly move the mouse pointer back and forth over the item of interest to keep the message displayed longer. This is fairly easy using a physical mouse, but I imagine it may be more difficult using the trackpad of a laptop.
As another tip, you can save plot setting using the Multi-plot Main "File" menu, send them to another computer, and then load the settings file on the other computer to recreate a plot, if there is ever a question of settings (or if you just want to recreate a plot at a later time).
Karen
| Free forum by Nabble | Edit this page |