Multiplot magnitude issue
Posted by wvinton on
URL: http://astroimagej.170.s1.nabble.com/Multiplot-magnitude-issue-tp267.html
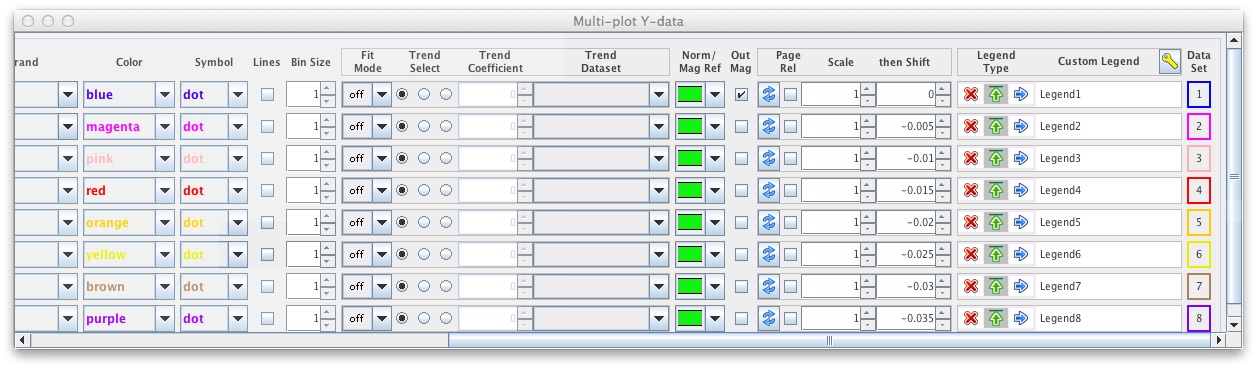
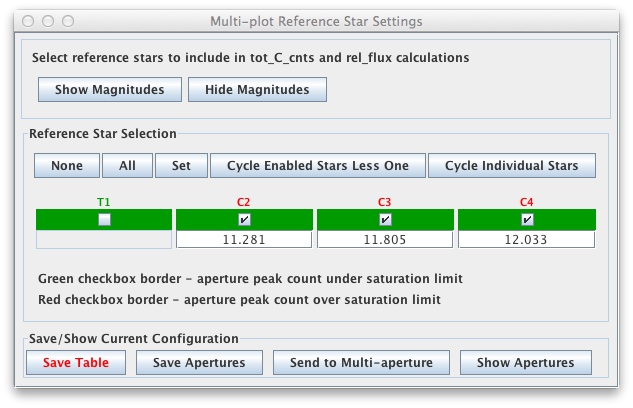
I'm having a little bit of a problem with getting the multiplot graph to have the correct y-values. The issue is that instead of plotting the actual value of the magnitude of the target star (which is around magnitude 11) the graphing routine insists on plotting what appears to be the difference in magnitude from some reference point (I'm not sure exactly what the "0" reference point is), with the y-axis running from -0.25 to .35. The data shows correctly in the measurements table column "Source_AMag_T1". A curious point is this - I'm working with a student who is using a MacBook, running MacOSX 10.9.3 to process the data (consists of 220 measurements). When I process the same set of data on my MacBook Pro (MacOSX 10.10.3 and more RAM), with (I think) all the settings the same, I end up getting a graph with the actual values of the magnitude (y-axis runs from 11.25 to 10.65). So, I'm not sure why the MacBook version doesn't show the actual magnitude values, and I'm not sure why the MacBook Pro works and the MacBook doesn't. The AstroImageJ version and Java version is the most current one. I'm attaching screen shots of all (I think) of the relevant windows - let me know if you need more info.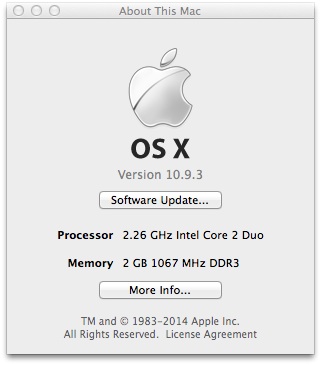


 One more thing - the tooltips help is really helpful - it's about the only place some of the functions are described. Is there anyway to make the tooltips hint show for a longer time? There's barely enough time to read some of the hints before they disappear, and it's way to short for those of us trying to figure out the meaning of the hint.
Thanks.
One more thing - the tooltips help is really helpful - it's about the only place some of the functions are described. Is there anyway to make the tooltips hint show for a longer time? There's barely enough time to read some of the hints before they disappear, and it's way to short for those of us trying to figure out the meaning of the hint.
Thanks.
URL: http://astroimagej.170.s1.nabble.com/Multiplot-magnitude-issue-tp267.html
I'm having a little bit of a problem with getting the multiplot graph to have the correct y-values. The issue is that instead of plotting the actual value of the magnitude of the target star (which is around magnitude 11) the graphing routine insists on plotting what appears to be the difference in magnitude from some reference point (I'm not sure exactly what the "0" reference point is), with the y-axis running from -0.25 to .35. The data shows correctly in the measurements table column "Source_AMag_T1". A curious point is this - I'm working with a student who is using a MacBook, running MacOSX 10.9.3 to process the data (consists of 220 measurements). When I process the same set of data on my MacBook Pro (MacOSX 10.10.3 and more RAM), with (I think) all the settings the same, I end up getting a graph with the actual values of the magnitude (y-axis runs from 11.25 to 10.65). So, I'm not sure why the MacBook version doesn't show the actual magnitude values, and I'm not sure why the MacBook Pro works and the MacBook doesn't. The AstroImageJ version and Java version is the most current one. I'm attaching screen shots of all (I think) of the relevant windows - let me know if you need more info.
One more thing - the tooltips help is really helpful - it's about the only place some of the functions are described. Is there anyway to make the tooltips hint show for a longer time? There's barely enough time to read some of the hints before they disappear, and it's way to short for those of us trying to figure out the meaning of the hint.
Thanks.
| Free forum by Nabble | Edit this page |