Re: Accesing to Measurements from a Macro
Posted by karenacollins on
URL: http://astroimagej.170.s1.nabble.com/Accesing-to-Measurements-from-a-Macro-tp211p222.html
Hi Ferran,
Could you try the new MPC formatting capability that is in the current 'daily build'?
Instructions for updating to the daily build are here:
http://astroimagej.1065399.n5.nabble.com/After-a-fresh-installation-of-AIJ-be-sure-to-update-to-the-latest-build-td142.html
Before starting the MPC format, you need to decide whether you want to submit a fixed value for magnitude for all rows in the measurements table or if you want to use a custom value for each row derived from something like rel_flux_T1. A constant magnitude value can be entered directly into the MPC user interface. To create a custom value for each row, you will need to know the offset from the zero-centered relative magnitude. Then you will add that value to the plotted magnitude value. To do that, follow these steps, otherwise jump to 'Setting Up MPC Formatting' near the bottom:
1) Open the measurements table into AIJ and start the Multi-plot function, which will load the open table for plotting. Alternatively, open Multi-plot by clicking the icon on the
AIJ toolbar and then drag and drop the table onto one of the plot
control windows.
icon on the
AIJ toolbar and then drag and drop the table onto one of the plot
control windows.
2) Plot the data in magnitude by enabling the "Out Mag" option on the appropriate row of the Multi-Plot_Y-data panel .
.
3) In the "then Shift" box, add the offset. For example, if the offset is 12 magnitudes, enter 12 like this . To work in
magnitudes rather than milli-magnitudes, make sure the 'Y x 1E'
setting is '0' on the Multi-plot Main panel, and make sure the
'scale' value on the appropriate plot row of the Multi-plot Y-data
panel is set to '1'.
. To work in
magnitudes rather than milli-magnitudes, make sure the 'Y x 1E'
setting is '0' on the Multi-plot Main panel, and make sure the
'scale' value on the appropriate plot row of the Multi-plot Y-data
panel is set to '1'.
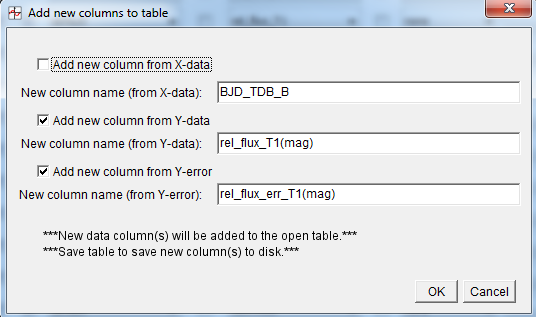
4) On the left-hand side of that row, click the "New Col"icon to add a new
data column to the table that contains the magnitude value plus the
shift value. A dialog panel will open and allow you to accept the
default new column name or you can change it as desired. Press OK to
save the new column(s). Here is an example of the dialog:
to add a new
data column to the table that contains the magnitude value plus the
shift value. A dialog panel will open and allow you to accept the
default new column name or you can change it as desired. Press OK to
save the new column(s). Here is an example of the dialog:
5) Now that you have the magnitude numbers for each row of the table, you can proceed to MPC formatting below.
Setting Up MPC Formatting:
--------------------------------------
1) If you haven't already done so above, open the measurements table into AIJ and start the Multi-plot function, which will automatically load the open table for plotting. Alternatively, open Multi-plot by clicking the icon on the AIJ toolbar and then drag and drop the table
onto any one of the plot control windows.
2) Open the new MPC formatting function at Multi-plot_Main->File->'Create Minor Planet Center (MPC) format...'.
2) File out the data as desired and select the JD UTC, RA, and Dec data columns. If you want to use a constant magnitude value, set 'Select magnitude column' to 'blank' and enter the magnitude value in the fixed magnitude box below the column selector. To use the new magnitude column added to the table from above, select the new magnitude column name (rel_flux_T1(mag) in the example above).
3) Click OK and the MPC formatted data will be written to a log window from which it can be cut and pasted into a submission email.
4) All of the settings are remembered between sessions, which should save setup time after the first run.
Let me know if this does what you need. I'm still thinking about how to solve the problem of doing photometry on a target star that is moving relative to the comp stars.
Karen
URL: http://astroimagej.170.s1.nabble.com/Accesing-to-Measurements-from-a-Macro-tp211p222.html
Hi Ferran,
Could you try the new MPC formatting capability that is in the current 'daily build'?
Instructions for updating to the daily build are here:
http://astroimagej.1065399.n5.nabble.com/After-a-fresh-installation-of-AIJ-be-sure-to-update-to-the-latest-build-td142.html
Before starting the MPC format, you need to decide whether you want to submit a fixed value for magnitude for all rows in the measurements table or if you want to use a custom value for each row derived from something like rel_flux_T1. A constant magnitude value can be entered directly into the MPC user interface. To create a custom value for each row, you will need to know the offset from the zero-centered relative magnitude. Then you will add that value to the plotted magnitude value. To do that, follow these steps, otherwise jump to 'Setting Up MPC Formatting' near the bottom:
1) Open the measurements table into AIJ and start the Multi-plot function, which will load the open table for plotting. Alternatively, open Multi-plot by clicking the
icon on the
AIJ toolbar and then drag and drop the table onto one of the plot
control windows.2) Plot the data in magnitude by enabling the "Out Mag" option on the appropriate row of the Multi-Plot_Y-data panel
.3) In the "then Shift" box, add the offset. For example, if the offset is 12 magnitudes, enter 12 like this
. To work in
magnitudes rather than milli-magnitudes, make sure the 'Y x 1E'
setting is '0' on the Multi-plot Main panel, and make sure the
'scale' value on the appropriate plot row of the Multi-plot Y-data
panel is set to '1'.4) On the left-hand side of that row, click the "New Col"icon
to add a new
data column to the table that contains the magnitude value plus the
shift value. A dialog panel will open and allow you to accept the
default new column name or you can change it as desired. Press OK to
save the new column(s). Here is an example of the dialog:5) Now that you have the magnitude numbers for each row of the table, you can proceed to MPC formatting below.
Setting Up MPC Formatting:
--------------------------------------
1) If you haven't already done so above, open the measurements table into AIJ and start the Multi-plot function, which will automatically load the open table for plotting. Alternatively, open Multi-plot by clicking the
icon on the AIJ toolbar and then drag and drop the table
onto any one of the plot control windows.2) Open the new MPC formatting function at Multi-plot_Main->File->'Create Minor Planet Center (MPC) format...'.
2) File out the data as desired and select the JD UTC, RA, and Dec data columns. If you want to use a constant magnitude value, set 'Select magnitude column' to 'blank' and enter the magnitude value in the fixed magnitude box below the column selector. To use the new magnitude column added to the table from above, select the new magnitude column name (rel_flux_T1(mag) in the example above).
3) Click OK and the MPC formatted data will be written to a log window from which it can be cut and pasted into a submission email.
4) All of the settings are remembered between sessions, which should save setup time after the first run.
Let me know if this does what you need. I'm still thinking about how to solve the problem of doing photometry on a target star that is moving relative to the comp stars.
Karen
| Free forum by Nabble | Edit this page |