Re: Multi-plot graphing issue.
Posted by wvinton on Jul 25, 2022; 6:25pm
URL: http://astroimagej.170.s1.nabble.com/Multi-plot-graphing-issue-tp1957p1961.html
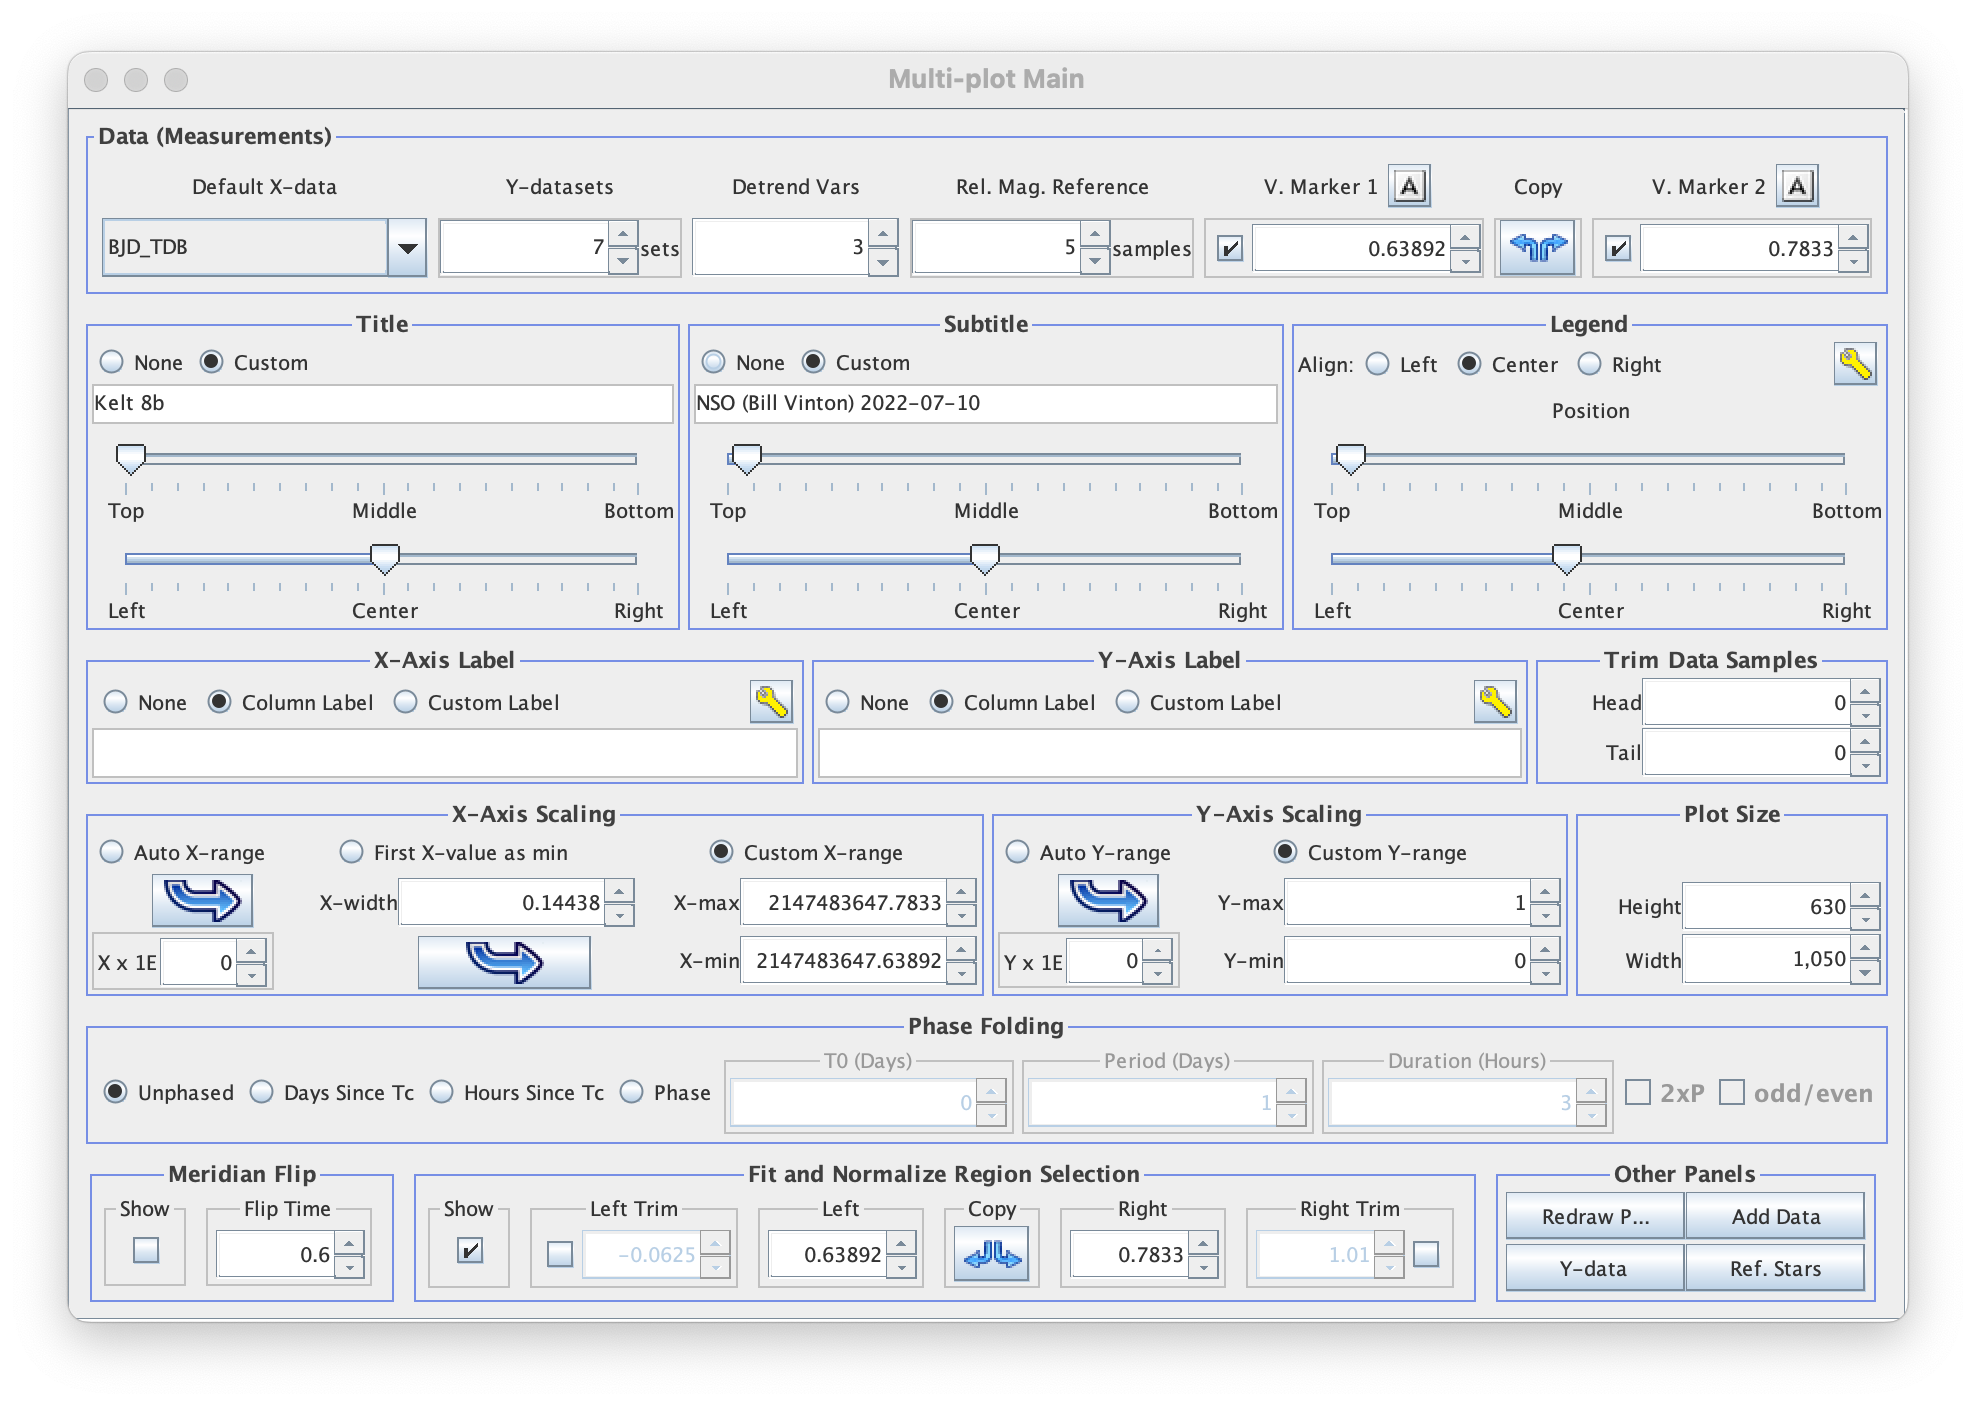
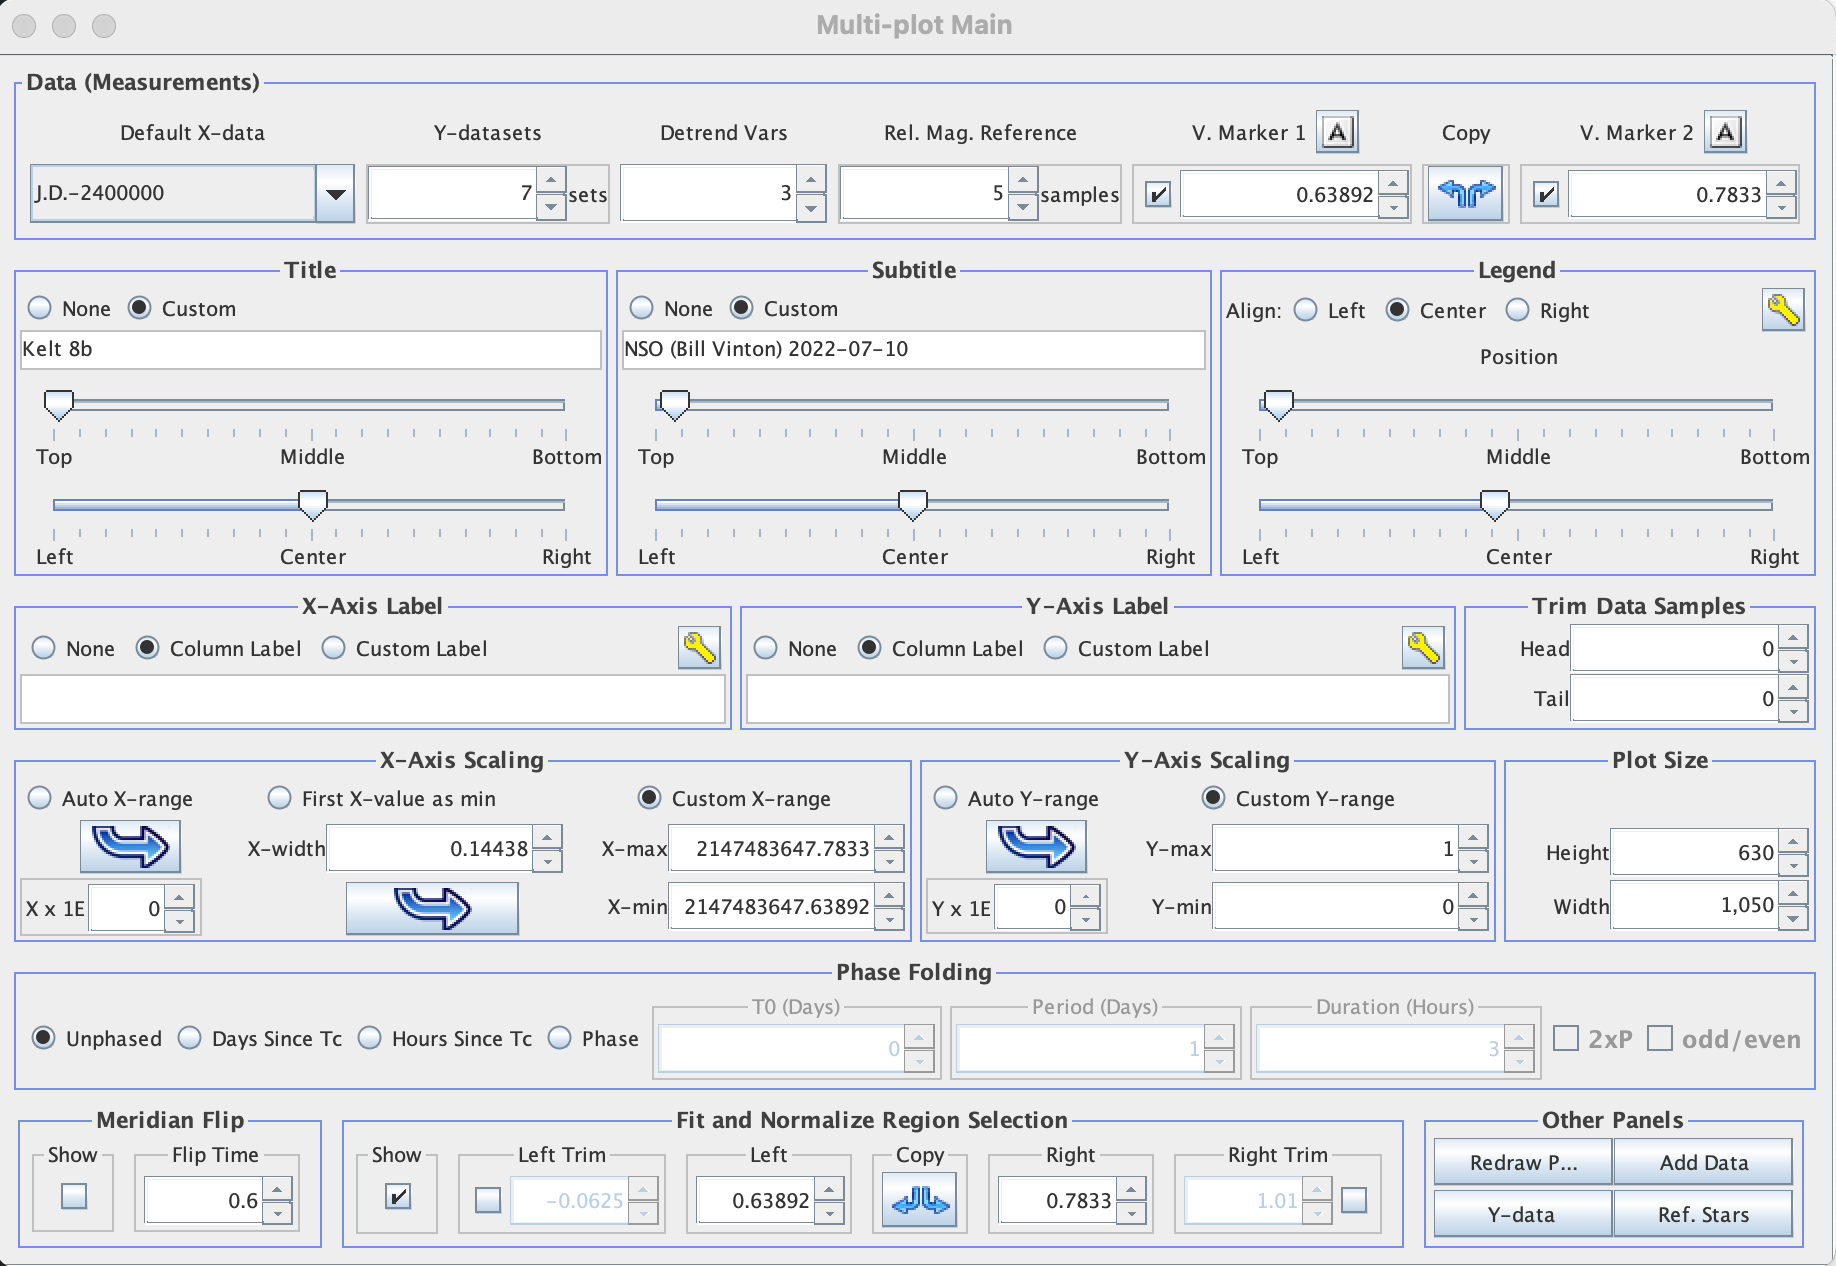
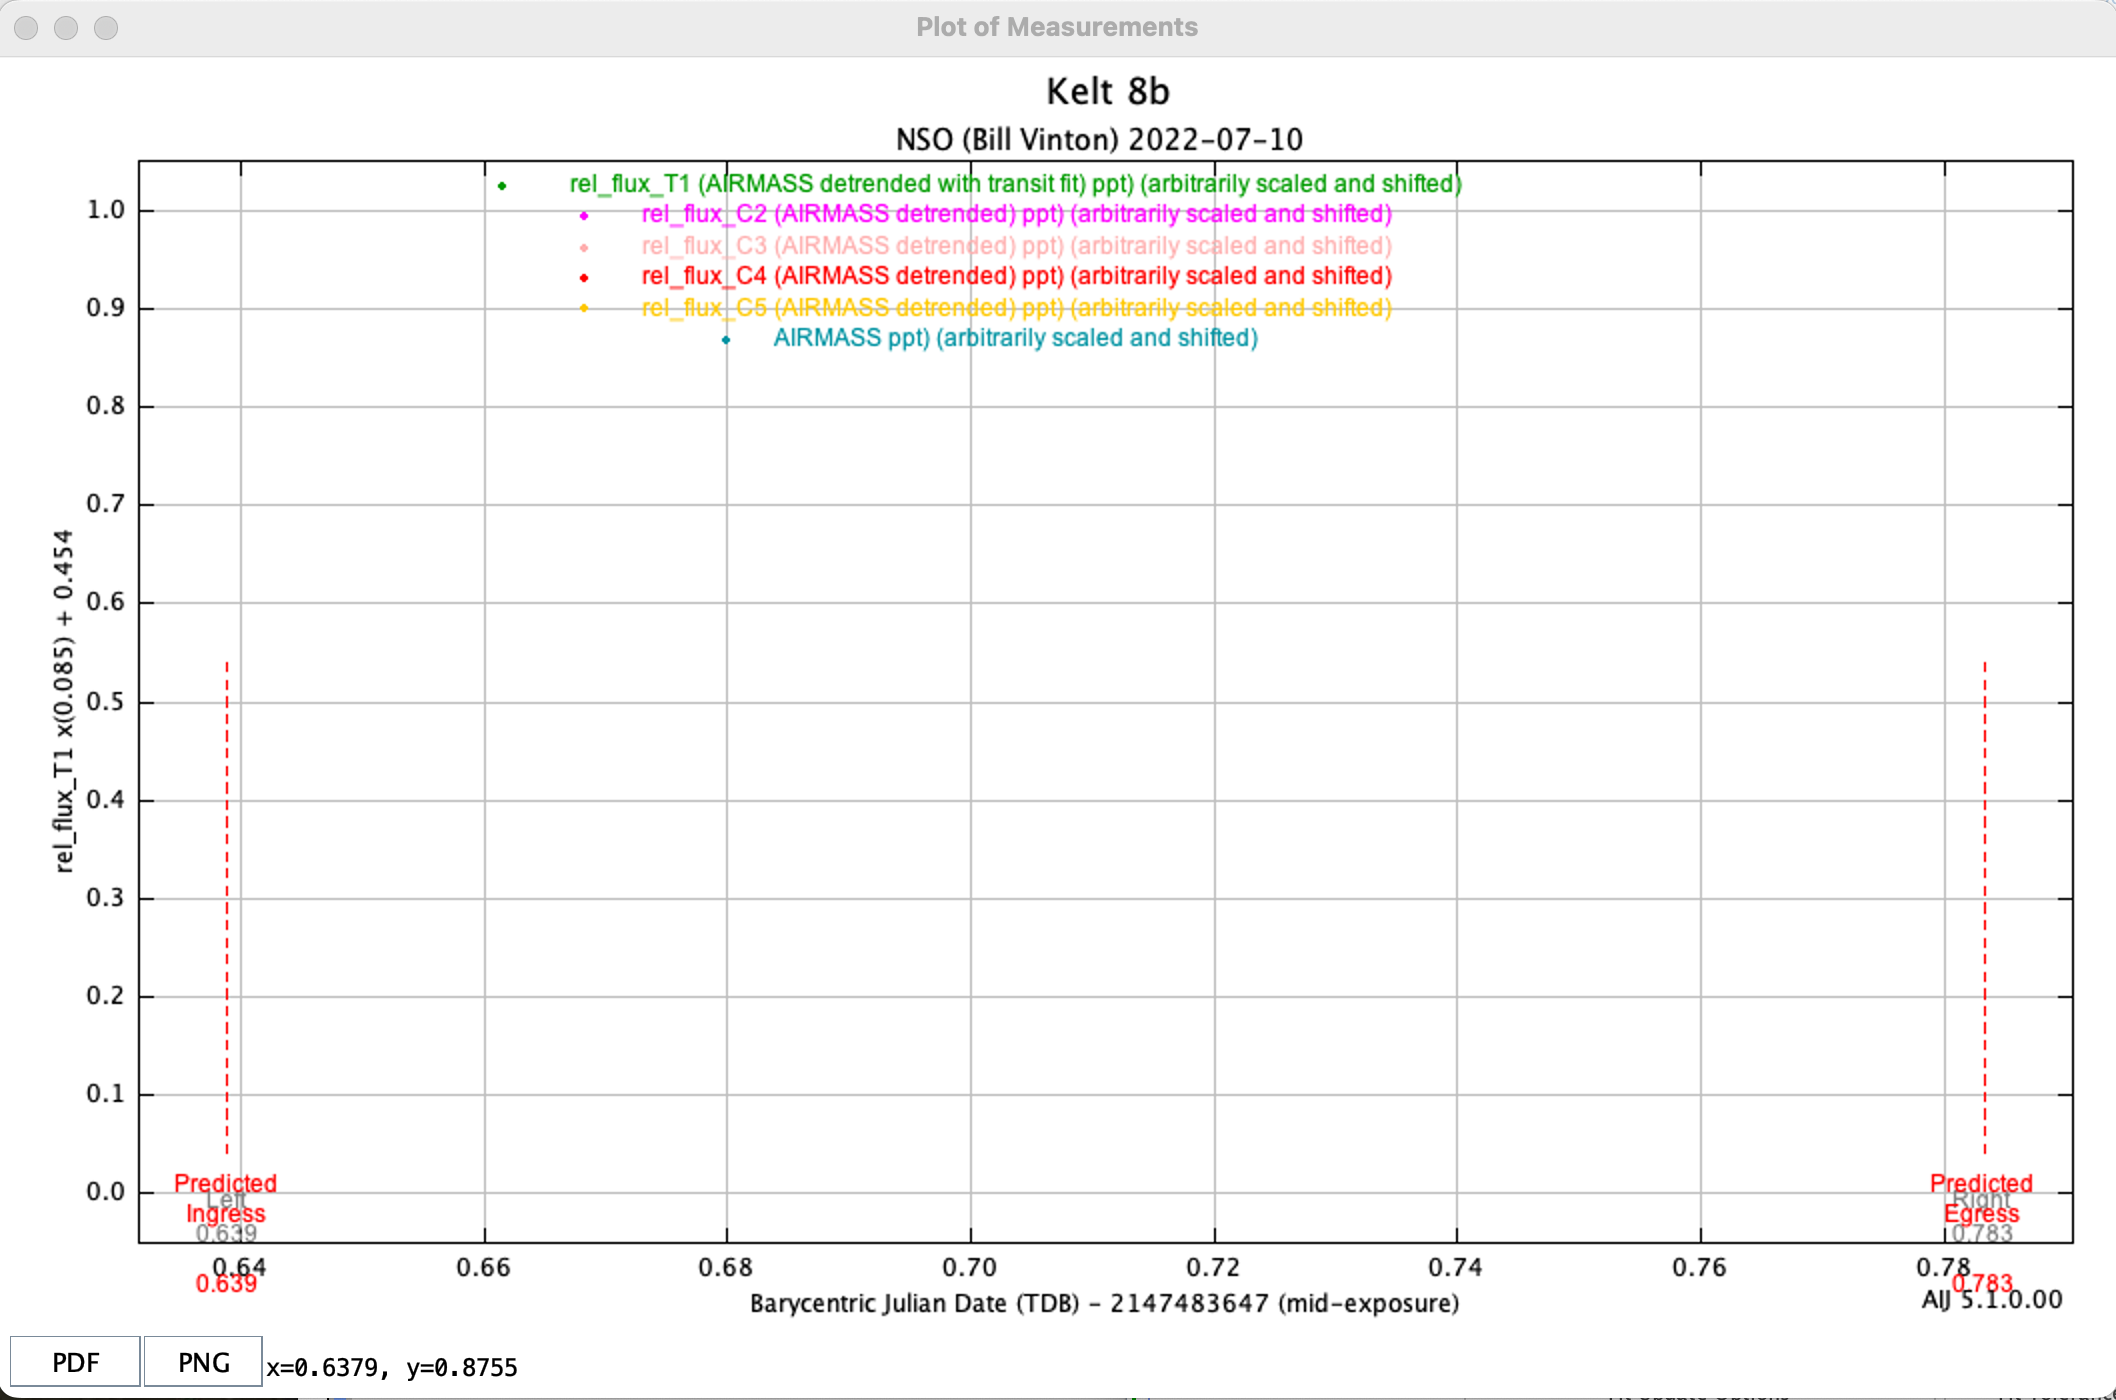
Here are several screen shots plus the measurements table and plotfcfg files. Notice that the x-axis seems to be showing correctly now (?!?) but that the label seems to be stuck on "BJD-TDB - 2147483647". The y-data seem to be stuck though, with a min-max of 0 to 1, no matter what I do. Hope you can make sense of this!


 Measurements.plotcfg
Measurements.xls
Thanks for everything - especially your promptness!
Bill
URL: http://astroimagej.170.s1.nabble.com/Multi-plot-graphing-issue-tp1957p1961.html
Here are several screen shots plus the measurements table and plotfcfg files. Notice that the x-axis seems to be showing correctly now (?!?) but that the label seems to be stuck on "BJD-TDB - 2147483647". The y-data seem to be stuck though, with a min-max of 0 to 1, no matter what I do. Hope you can make sense of this!


 Measurements.plotcfg
Measurements.xls
Thanks for everything - especially your promptness!
Bill
| Free forum by Nabble | Edit this page |