Re: Multi-Plot Problem during Multi-Aperture process
Posted by karenacollins on
URL: http://astroimagej.170.s1.nabble.com/Multi-Plot-Problem-during-Multi-Aperture-process-tp136p147.html
Hi Bill,
I still have not been able to find the sequence of events that causes an image to disappear. Based on your description of events, I am starting to lean toward your suggestion that it has something to do with running standard ImageJ and then moving back to AIJ. I haven't been successful in causing it to happen though. Famous last words, but I'm not sure what could possibly cause such an issue. If you have time and are able to determine a specific set of steps that causes the problem to occur, it would be much appreciated and might help me pinpoint what is going wrong. The error message you sent actually comes from the underlying ImageJ code, and is triggered because the code is trying to find the width of the image, but the image does not exist (as you clearly experienced).
I think the problem you are having displaying multiple light curves on the same plot is that you need to either plot in relative magnitude, or in normalized relative flux (i.e. scaled so that a light curve has an average value of 1.0). The values of rel_flux_T1, rel_flux_C2, etc. are simply the star's counts divided by the total counts in the reference star ensemble. For a comp star, the ensemble used to calculate relative flux includes all OTHER comp stars. A side effect of that is that you need at least 2 comp stars to plot a comp star light curve.
Because relative flux is the simple division of a star's flux by the ensemble's flux, the average values of relative flux for different stars can be vastly different in the absolute sense, so would show up at potentially very different places on the y-axis of a plot. To bring them all onto the same scale, you either need to enable "Normalization" or output in relative magnitude.
To normalize a light curve, enable a mode of normalization on each line. I think what you need is the mode that normalizes the light curve based on all of its data as shown below. Select this mode on each line you are plotting:
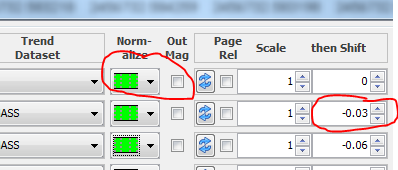
You can offset each curve for clarity by adjusting the "Shift" value circled above.
If you would rather plot in Magnitude, enable the "Out Mag" option to the right of the normalize selection. Normalize can be left on or off. In output in magnitude mode, all data points are referenced to the average of the first few data points and then converted to astronomical magnitude, with zero magnitude being the average of the first few data points. The amount of "few" that I am referring to is set on the Multi-plot Main panel. For what you are doing you may want to set it to "1", then all magnitudes are referenced to the first data point:
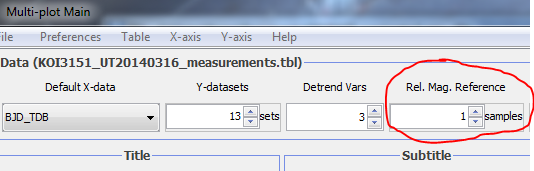
Then, if you know the conversion of that first data point to absolute magnitude for your instrumentation, you can make that adjustment using the "Shift" setting shown two screen grabs above.
Going forward, if there are operational help questions separate from the image disappearance problem, it's probably best to start a new topic on each one so other users can more easily search for topics. Lets continue the image disappearing problem here, if you have more time to work on it.
Thanks,
Karen
URL: http://astroimagej.170.s1.nabble.com/Multi-Plot-Problem-during-Multi-Aperture-process-tp136p147.html
Hi Bill,
I still have not been able to find the sequence of events that causes an image to disappear. Based on your description of events, I am starting to lean toward your suggestion that it has something to do with running standard ImageJ and then moving back to AIJ. I haven't been successful in causing it to happen though. Famous last words, but I'm not sure what could possibly cause such an issue. If you have time and are able to determine a specific set of steps that causes the problem to occur, it would be much appreciated and might help me pinpoint what is going wrong. The error message you sent actually comes from the underlying ImageJ code, and is triggered because the code is trying to find the width of the image, but the image does not exist (as you clearly experienced).
I think the problem you are having displaying multiple light curves on the same plot is that you need to either plot in relative magnitude, or in normalized relative flux (i.e. scaled so that a light curve has an average value of 1.0). The values of rel_flux_T1, rel_flux_C2, etc. are simply the star's counts divided by the total counts in the reference star ensemble. For a comp star, the ensemble used to calculate relative flux includes all OTHER comp stars. A side effect of that is that you need at least 2 comp stars to plot a comp star light curve.
Because relative flux is the simple division of a star's flux by the ensemble's flux, the average values of relative flux for different stars can be vastly different in the absolute sense, so would show up at potentially very different places on the y-axis of a plot. To bring them all onto the same scale, you either need to enable "Normalization" or output in relative magnitude.
To normalize a light curve, enable a mode of normalization on each line. I think what you need is the mode that normalizes the light curve based on all of its data as shown below. Select this mode on each line you are plotting:
You can offset each curve for clarity by adjusting the "Shift" value circled above.
If you would rather plot in Magnitude, enable the "Out Mag" option to the right of the normalize selection. Normalize can be left on or off. In output in magnitude mode, all data points are referenced to the average of the first few data points and then converted to astronomical magnitude, with zero magnitude being the average of the first few data points. The amount of "few" that I am referring to is set on the Multi-plot Main panel. For what you are doing you may want to set it to "1", then all magnitudes are referenced to the first data point:
Then, if you know the conversion of that first data point to absolute magnitude for your instrumentation, you can make that adjustment using the "Shift" setting shown two screen grabs above.
Going forward, if there are operational help questions separate from the image disappearance problem, it's probably best to start a new topic on each one so other users can more easily search for topics. Lets continue the image disappearing problem here, if you have more time to work on it.
Thanks,
Karen
If you reply to this email, your message will be added to the discussion below:http://astroimagej.1065399.n5.nabble.com/Multi-Plot-Problem-during-Multi-Aperture-process-tp136p146.htmlTo start a new topic under AstroImageJ, email [hidden email]
To unsubscribe from AstroImageJ, click here.
NAML
| Free forum by Nabble | Edit this page |