Re: Perform Differential Relative Photometry on a Time Series of Images
Posted by karenacollins on
URL: http://astroimagej.170.s1.nabble.com/Perform-Differential-Relative-Photometry-on-a-Time-Series-of-Images-tp234p1009.html
Hi Ganesh,
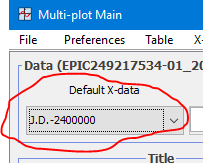
The setting for the default time (x-axis) data column is at the top left of the Multi-Plot_Main panel. Try "J.D.-2400000" first:
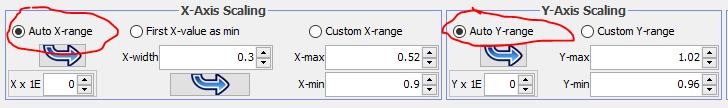
Also, make sure the X-axis and Y-axis scaling are set to "Auto" on the same panel:
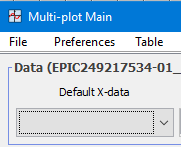
If that doesn't give you a plot of your data, set the Default X-axis column to "blank" like this:
which will force the Y-axis samples to be plotted at evenly spaced distances. This setting is not what you want as a final plot, but should give you a plot. Then we can figure out why the usual time columns are not working.
Karen
URL: http://astroimagej.170.s1.nabble.com/Perform-Differential-Relative-Photometry-on-a-Time-Series-of-Images-tp234p1009.html
Hi Ganesh,
The setting for the default time (x-axis) data column is at the top left of the Multi-Plot_Main panel. Try "J.D.-2400000" first:
Also, make sure the X-axis and Y-axis scaling are set to "Auto" on the same panel:
If that doesn't give you a plot of your data, set the Default X-axis column to "blank" like this:
which will force the Y-axis samples to be plotted at evenly spaced distances. This setting is not what you want as a final plot, but should give you a plot. Then we can figure out why the usual time columns are not working.
Karen
On 5/24/2018 1:00 AM, Ganesh [via AstroImageJ] wrote:
Hi Karen,
I was using IRIS for variable star photometry. But data analysis by IRIS is quite lengthier
Now I'm learning to use astroimagej. While performing multi-aperture photometry there is no change in x axis of plot I.e time. Where should I add time in the graph.
May be I'm missing something option. Please help me in this.
Regards,
Ganesh Pawar
If you reply to this email, your message will be added to the discussion below:http://astroimagej.1065399.n5.nabble.com/Perform-Differential-Relative-Photometry-on-a-Time-Series-of-Images-tp234p1008.htmlTo start a new topic under How to accomplish specific tasks in AstroImageJ, email [hidden email]
To unsubscribe from AstroImageJ, click here.
NAML
| Free forum by Nabble | Edit this page |