flux

classic Classic list List threaded Threaded
6 messages Options
Reply | Threaded
Open this post in threaded view
|

flux

Henk
Hello
If I do a meassurement everything turns gree but the rel_flux_T1 and the rel_flux_err_T1 are way of.
I dont see how it can be.
rel_flux_T1 = 0.09000548      rel_flux_err_T1 = 2.81708.
So a Mag calculation is not possible.
Does anyone knows what goe wrong here?
All the reference star boxes are green.
ImageJ 1.54m1

regards

Henk

https://sites.google.com/view/grandpajunkrat/home


Reply | Threaded
Open this post in threaded view
|

Re: flux

karenacollins
Administrator
Hi Henk,

Please show full screen grabs of your Multi-aperture Main and Multi-plot Y-data panels, and we'll check the set-up of the plot.

Karen
Reply | Threaded
Open this post in threaded view
|

Re: flux

Henk
Hi Karen,

Here are the screen prints.
I am working on calibrating all the software.
Last week, I started a 5-year survey of a region within Cepheus OB3.
The target star is TYC 4282-598-1 with a V mag of 10.85 (Simbad).
For the survey, I am aiming to observe YSOs with a V mag between 15 and 21.
The analysis for the paper will be based on relative flux rather than magnitudes.


Best regards

Henk

https://sites.google.com/view/grandpajunkrat/home


Reply | Threaded
Open this post in threaded view
|

Re: flux

karenacollins
Administrator
In reply to this post by Henk
Hi Henk,

I'm not 100% sure what you'd like to plot, but it sounds like you want to plot rel_flux_T1 without normalization and without a shift. To do so, go to the Y-data panel row 4 (where you are plotting rel_flux_T1), and disable the "Norm/Mag Ref" by clicking the solid green indicator and then select "off". Then move further to the right to the "then shift" column and type in 0.0 and press enter.

If you are needing to plot your data in a different format, please clarify what you are going for and/or what the intended use case is.

Karen
Reply | Threaded
Open this post in threaded view
|

Re: flux

Henk
Hello Karen,

Thank you for your patience. Please allow me to clarify my previous message; I apologize for any lack of clarity.

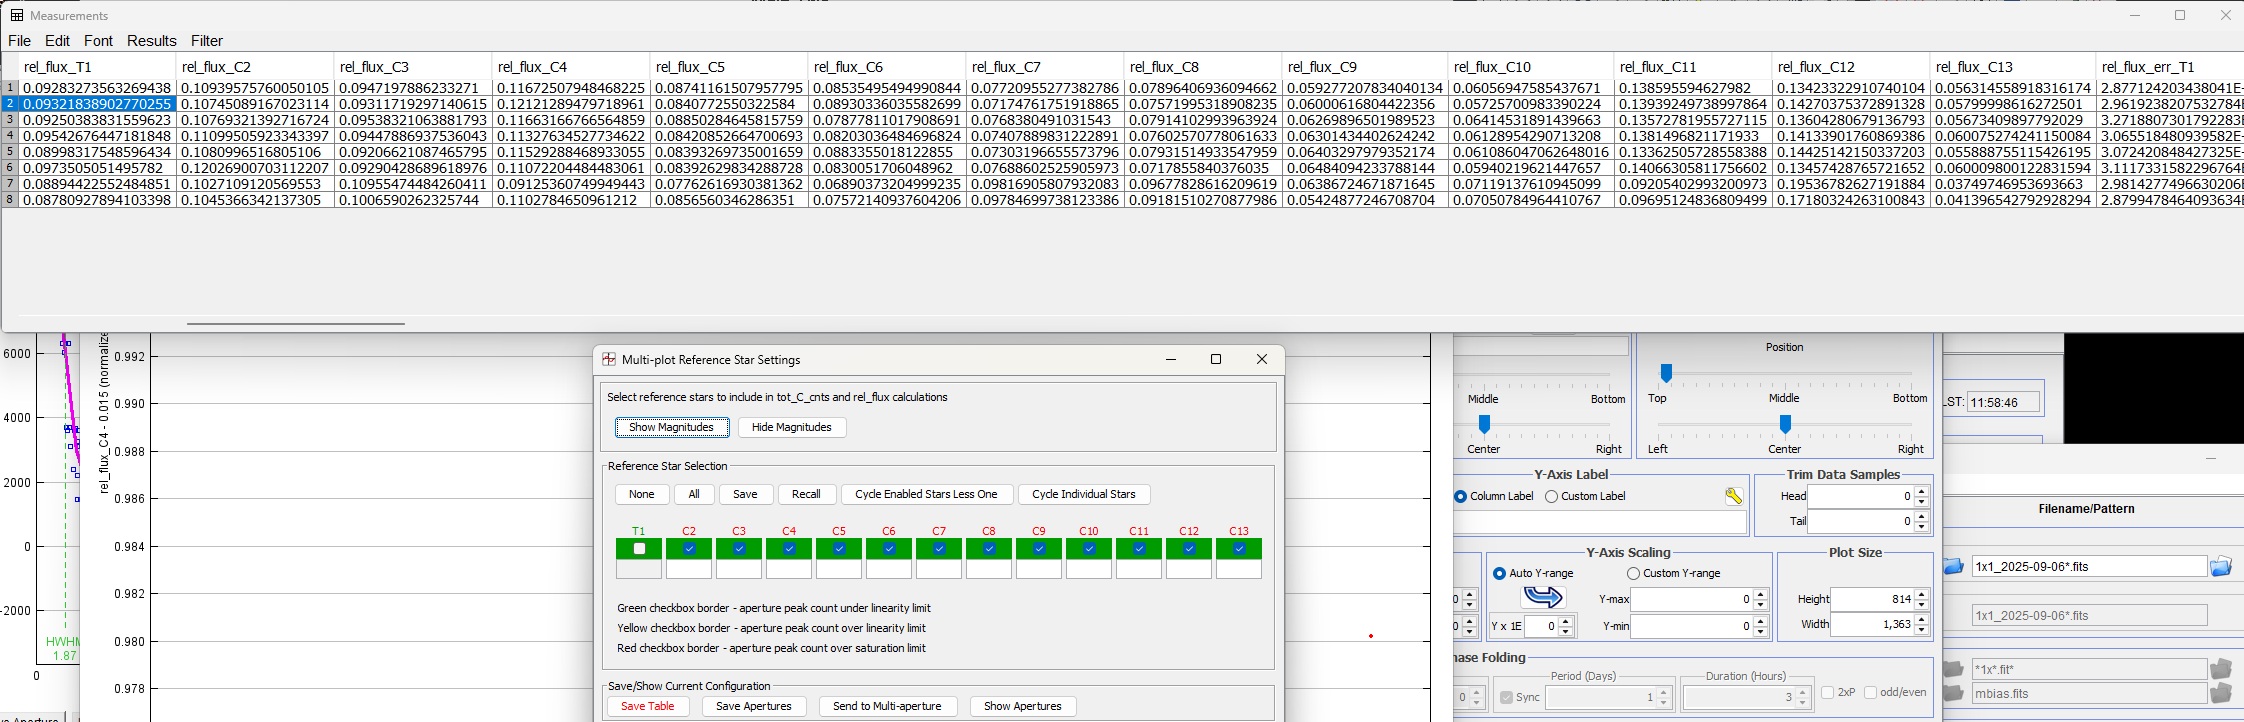
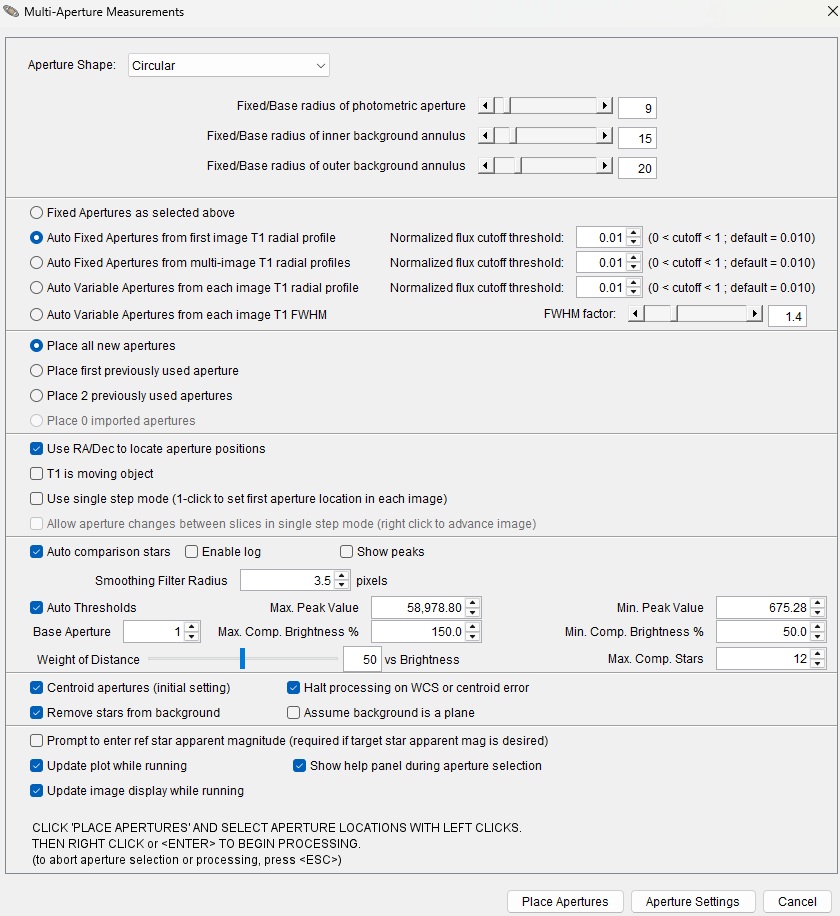
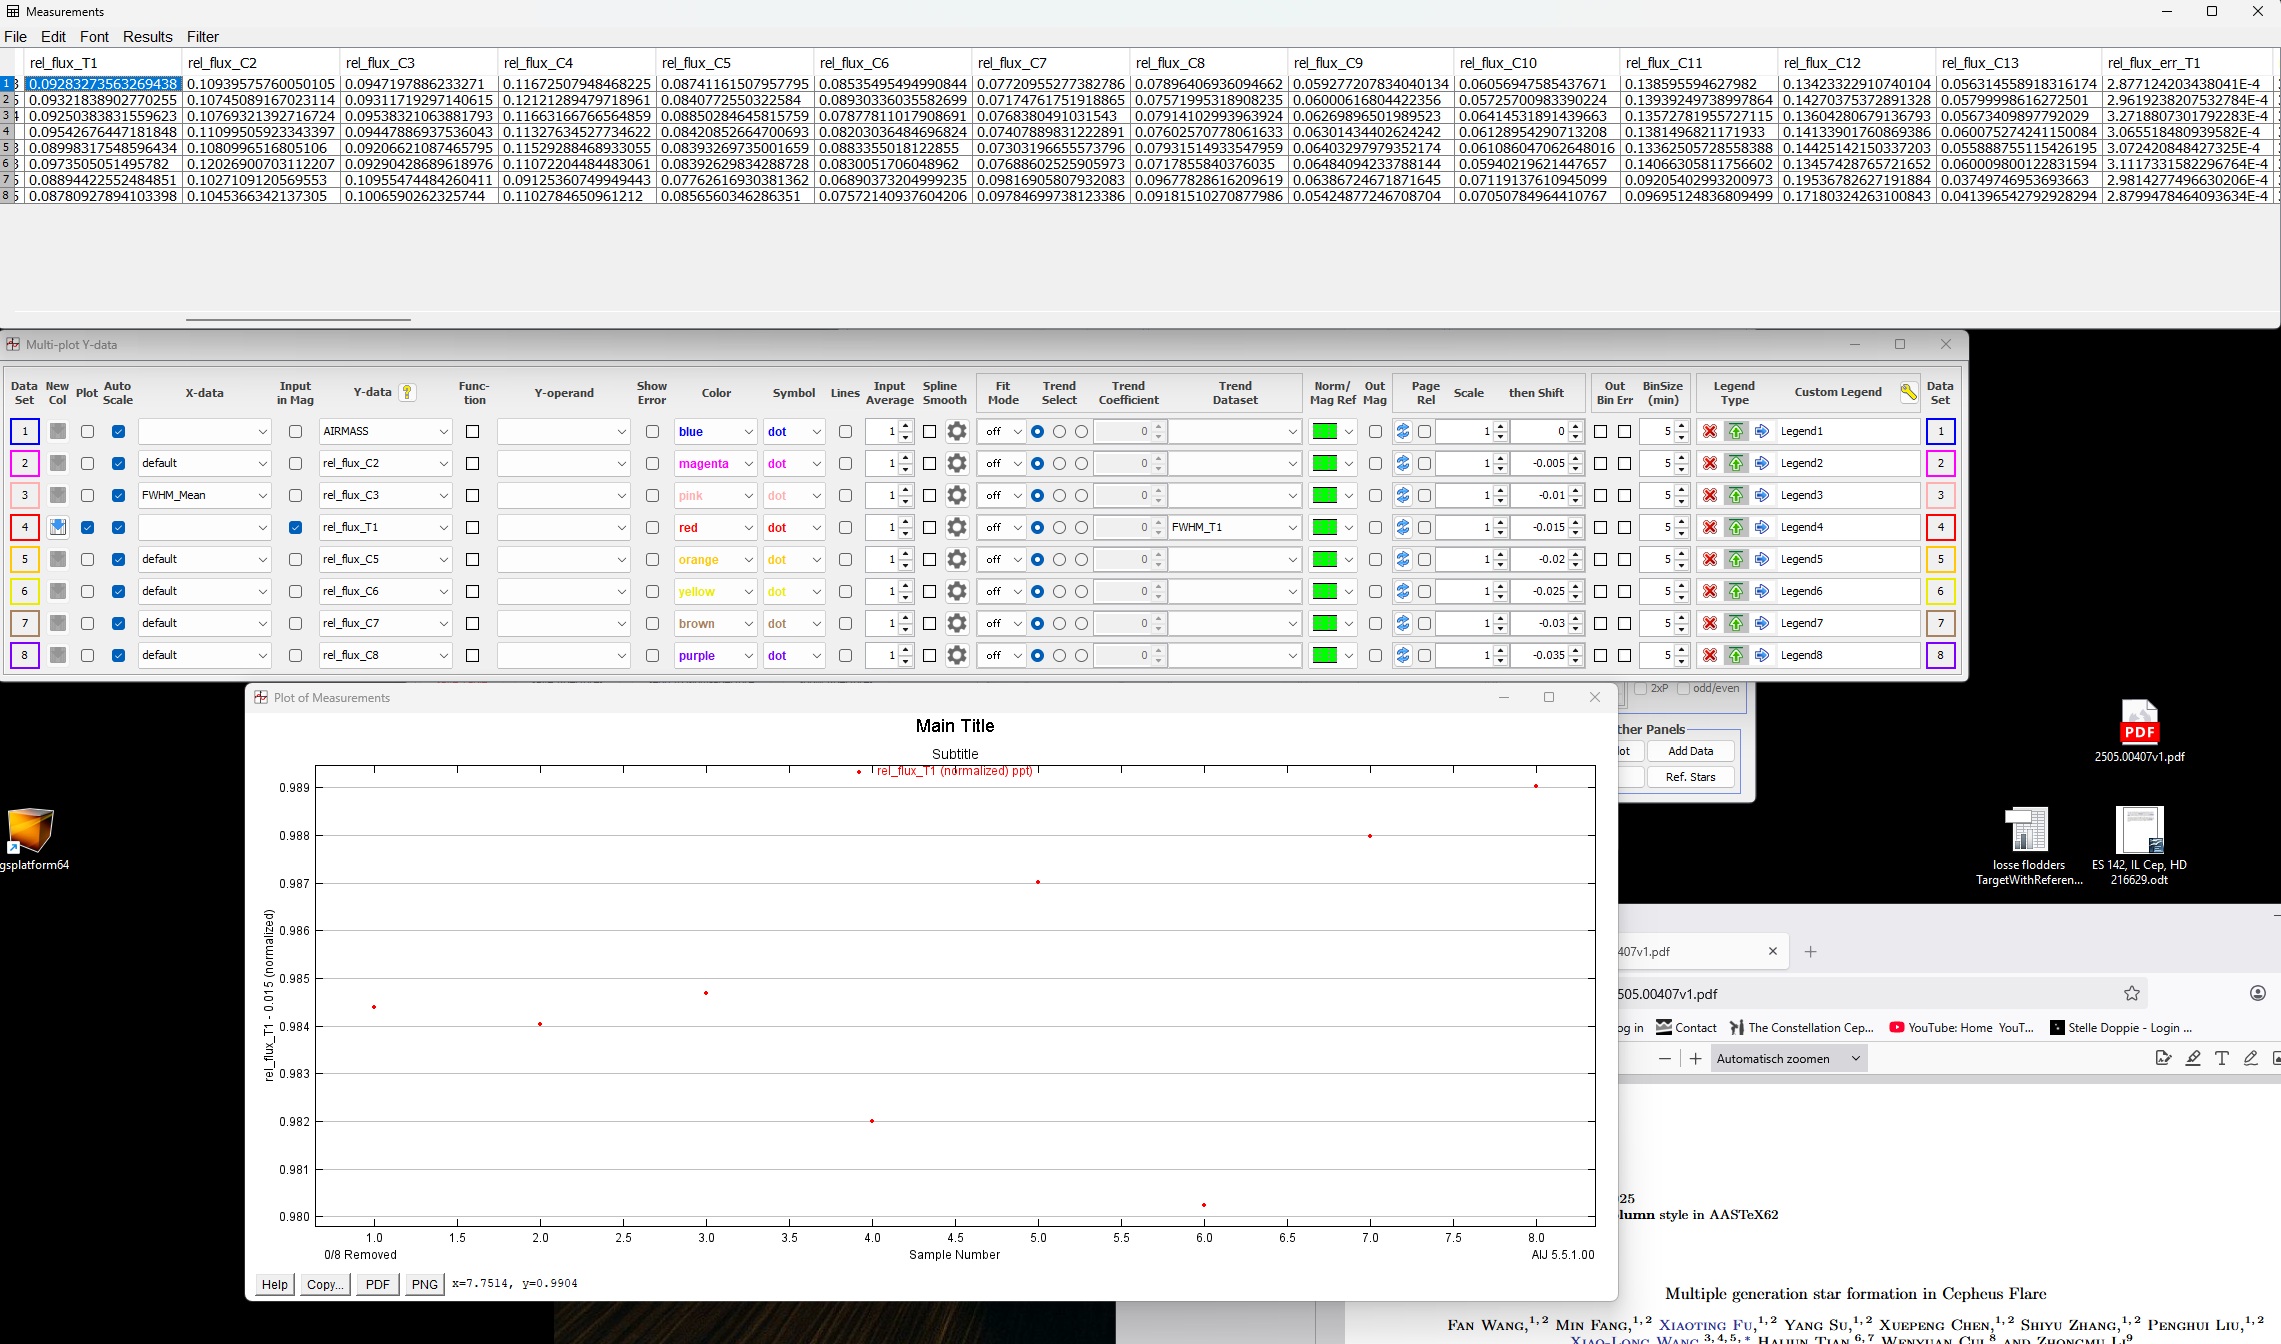
What I fundamentally need for my analysis are both types of flux values: the normalized relative flux (rel_flux_normalized) and the relative flux without normalization. The normalized data will be essential for studying subtle variability, while the non-normalized values are crucial for the absolute photometric calibration to the standard V-band system.

In addition to these flux values, I also require the associated data such as FWHM, airmass, and other pertinent metrics for a complete analysis.

I am entirely new to AstroImageJ and, I must admit, I am finding the initial learning curve to be quite steep. Any guidance you can offer would be immensely appreciated.

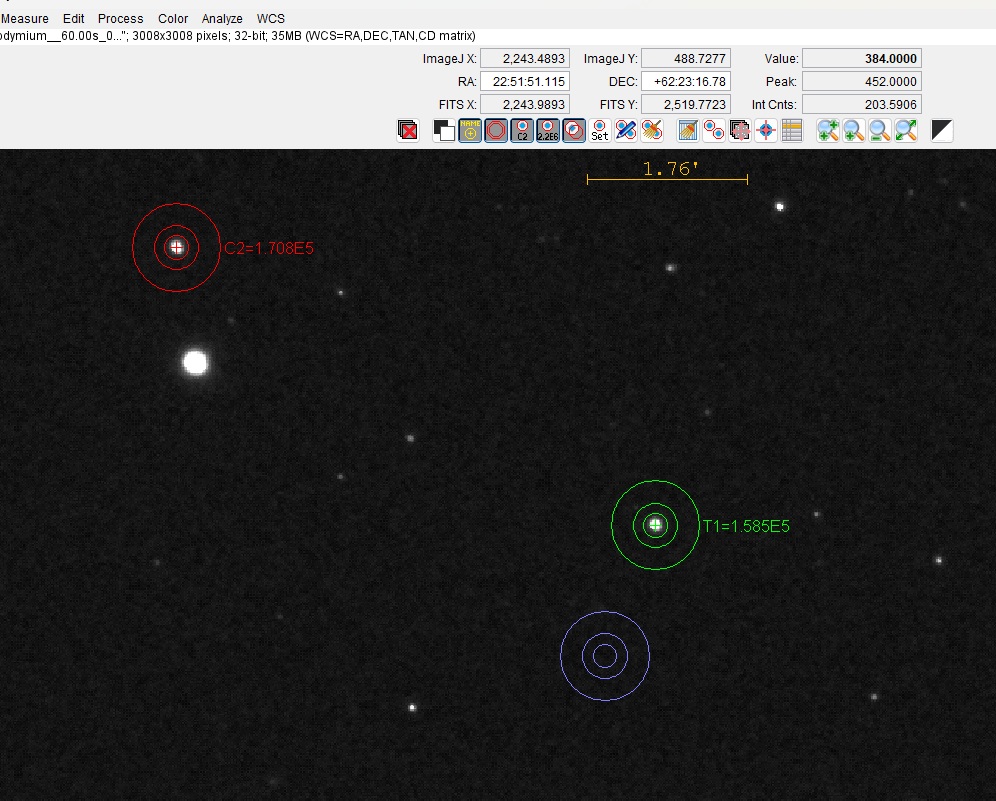
On a related note, I recently began a five-year photometric survey targeting a specific field in the Cepheus OB3 region. To document this project, I have established a "living paper" on my website: https://sites.google.com/view/grandpajunkrat/region-paper. This document will remain a conceptual work-in-progress for the duration of the survey, serving as a dynamic log of the methodology, data acquisition, and interim findings. The intention is to formally publish the final results and analysis in a peer-reviewed journal upon the survey's completion. The current version is an initial framework, which I am updating and expanding regularly.

Thank you for your time and assistance.

Best regards,

Henk
Reply | Threaded
Open this post in threaded view
|

Re: flux

karenacollins
Administrator
Hi Henk,

Since you are new to AIJ, you might consider reviewing the AstroImageJ sections in Dennis Conti's guide that is linked on the main page. It has good information, including plotting help. For your needs, you'd just plot any modified data (such as normalized relative flux) and then click the icon on the left of the corresponding row in Y-data panel labelled "New Col" to save that rows plotted data back into the measurements table. Then you could use "Save all" to save the measurements table and any other files that can be produced from what you have displayed to disk. Then you can output a simplified data file with only the columns you need outside of AIJ using Multi-Plot_Main => File => "Save data subset to file".

Congrats on getting your photometry survey up and running.

Karen