Loading... |
Reply to author |
Edit post |
Move post |
Delete this post |
Delete this post and replies |
Change post date |
Print post |
Permalink |
Raw mail |
All,
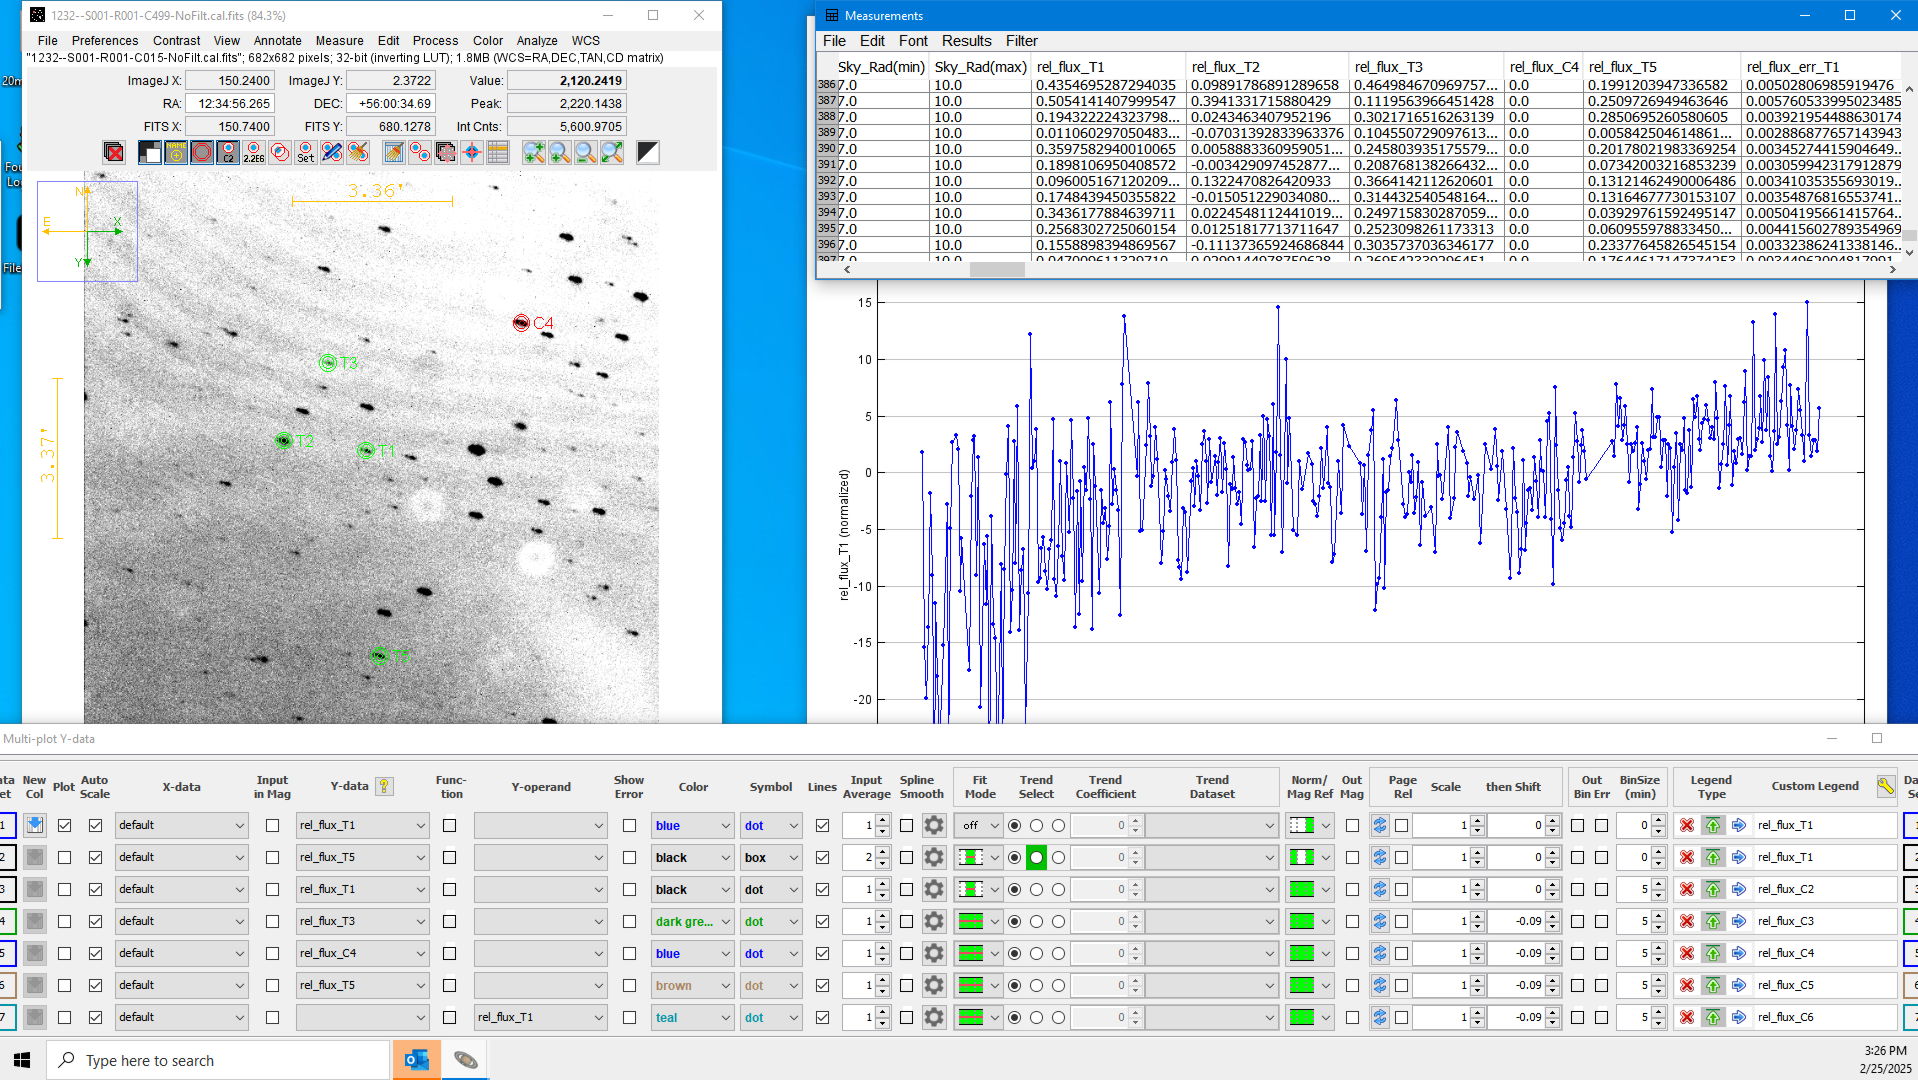
This problem appeared on my light curve plots where the X axis scale does not match the actual data. It appears to be about 10x different. My Yx1E = 0 and I think i have looked everywhere else to no avail. Any help appreciated. Thanks! Tom K |
Loading... |
Reply to author |
Edit post |
Move post |
Delete this post |
Delete this post and replies |
Change post date |
Print post |
Permalink |
Raw mail |
Administrator
|
Hi Tom,
In your original email, you mentioned that the Y-axis scale was the one that was off by a factor of 10. If it is really the X-axis, I'm sure you've also made sure Xx1E=0 also. In the latest version, we prevent the X-axis Xx1E=0 from being changed from 0, so if you are up-to-date, then I don't think this can be your problem. Assuming you are still having the problem, please post a screen grab of your plot and the Multi-plot Main panel so that I can see your set up and the plotting result. Also, let us know the version of AIJ that you are running (click in the lower portion of the toolbar to show the version). Karen |
Loading... |
Reply to author |
Edit post |
Move post |
Delete this post |
Delete this post and replies |
Change post date |
Print post |
Permalink |
Raw mail |
My bad, should not post so late. Yes it is the Y axis not the X axis.
|
Loading... |
Reply to author |
Edit post |
Move post |
Delete this post |
Delete this post and replies |
Change post date |
Print post |
Permalink |
Raw mail |
Here is a screen shot with the relevant data.
Thanks! Tom ![]() |
Loading... |
Reply to author |
Edit post |
Move post |
Delete this post |
Delete this post and replies |
Change post date |
Print post |
Permalink |
Raw mail |
Administrator
|
Hi Tom,
In the legend on your plot, I noticed that you are using rel_flux_T1 (and airmass) to detrend rel_flux_T1. The is effectively scaling your signal by the same signal, likely producing the problem you are seeing. After removing the rel_flux_T1 detrending, see if your problem is resolved. If there are issues remaining after making that correction, also post a screen grab of your Multi-plot Y-data panel. Karen |
Loading... |
Reply to author |
Edit post |
Move post |
Delete this post |
Delete this post and replies |
Change post date |
Print post |
Permalink |
Raw mail |
![]() Thanks for the reply. I have been down that road and that is not the problem. See this screen shot from last night. Also as the data is coming in, the size of the plot changes up and down but the Y scale does not. I recently bought a brand new Win 11 laptop so I downloaded AIJ and installed it in that thinking maybe something is wrong with my computer. When I start the program and push the button to Display Multi Aperture Settings the next time it runs, it bypasses that window and just starts processing. I can’t get to the setup to do a run. Has the program been tested on Win 11?? Thanks, Tom |
Loading... |
Reply to author |
Edit post |
Move post |
Delete this post |
Delete this post and replies |
Change post date |
Print post |
Permalink |
Raw mail |
Administrator
|
Hi Tom,
Thanks for the additional information. I don't see anything obviously wrong in your settings. AIJ is well tested with Windows 11 (it's what I use daily). The next step is to load up the data that produces the plot you are showing below. Then go to Multi-plot main > File > "Save all AIJ prefs to backup file". Then send to my email address the backup prefs file that you saved and also send me the measurements table that you are using to produce the plot. I'll see if I can reproduce the problem on my end. Karen |
Loading... |
Reply to author |
Edit post |
Move post |
Delete this post |
Delete this post and replies |
Change post date |
Print post |
Permalink |
Raw mail |
Administrator
|
Hi Tom,
I finally had a chance to investigate the problem you are having with the files you sent. Although the setup is a little different than the what is in the plot you show above, the problem is probably the same in both cases. In the measurements table you sent, most of your relative flux values are negative, and most are very close to zero. This causes the normalization to blow up some of the values to much larger numbers (although still centered at 1.0). If you want to plot the actually rel_flux_T1 values without modification, you need to set the normalization option in the Y-data panel (on the row your are plotting) to "off". I'm not sure why your rel_flux values have many negative numbers. While negative rel_flux values can legitimately occur, most values in the table being negative seems to suggest a problem with your photometry run from multi-aperture (in other word, the flux in either your target star aperture or comp star aperture is lower than the sky background, rather than brighter such as when a star is in the aperture). Karen |
Loading... |
Reply to author |
Edit post |
Move post |
Delete this post |
Delete this post and replies |
Change post date |
Print post |
Permalink |
Raw mail |
Thanks SO MUCH for getting back to me. Glad you found an explanation and I will look into the negative numbers. Very strange!
Thanks! Tom |
Free forum by Nabble | Edit this page |