Net integrated counts are contained in AIJ's Source-Sky_T1,
Source-Sky_C2, etc. The steps below outline how to convert those
values to arbitrary magnitude, then save them them to the
measurements table, and then to a separate file.
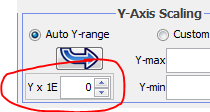
1) Make sure "Y x 1E" is set to '0' in the Y-Axis Scaling settings
on the "Multi-plot Main" panel. Setting this value to '3' will cause
values to be calculated in milli-mag rather than mag, if preferred.

2) On the first row of the 'Multi-plot Y-data' panel, select
"Source-Sky_T1" as the "Y-data" selection . Source-Sky_T1 is pretty
much what it indicates, the total of the source counts within the
aperture after subtracting the Sky value from each pixel.
3) Now convert those values to arbitrary magnitude. On the first row
of the 'Multi-plot Y-data' panel, select "Out Mag". Make sure
"Scale" is set to one and "then Shift" is set to zero. Also make
sure "Bin Size" is set to 1 on the first row.

3a) On the "Multi-plot Main" panel, make sure "Trim Data Samples"
"Head" and "Tail" are also set to zero.

4) Now save the values plotted in arbitrary magnitude back to the
measurements table. On the left side of the first plot row, click
the "New Col" icon (

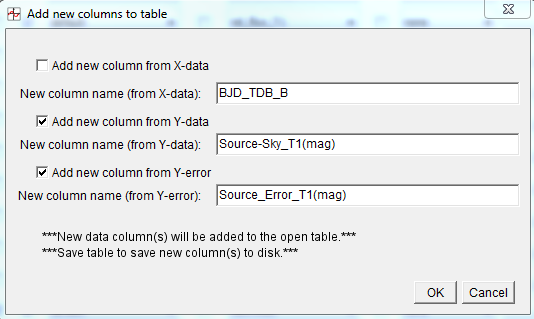
). Then a new
panel will open to allow you to set the new data column names for
what you are adding back to the measurements table. Label them
something like what is shown below (i.e. append something like
(mag)) to differentiate from the raw data column. You don't need to
save a new time column for this task. Now press OK and a new data
column in arbitrary magnitude will be added to the measurements
table. The Multi-plot panels will close and reopen to update with
the new data.

5) Calculate the comp star data in magnitude. Simply change the
"Y-data" column selection in the first row from Source-Sky_T1 to
Source-Sky_C2, etc. and perform step 4 above again. Then repeat this
step for each comp star. This step can be performed from the other
plot rows too, but make sure the "then Shift" value is set to 0.
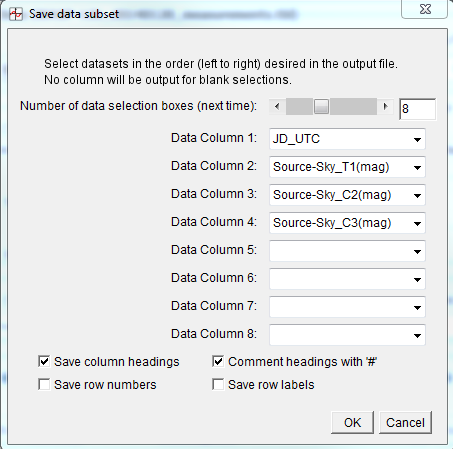
6) Save the JD/time and magnitude data to a file. Use "Multi-plot
Main"->File->"Save data subset to file..." and set the options
screen something like below and press OK, select a file name, click
SAVE. Done!
