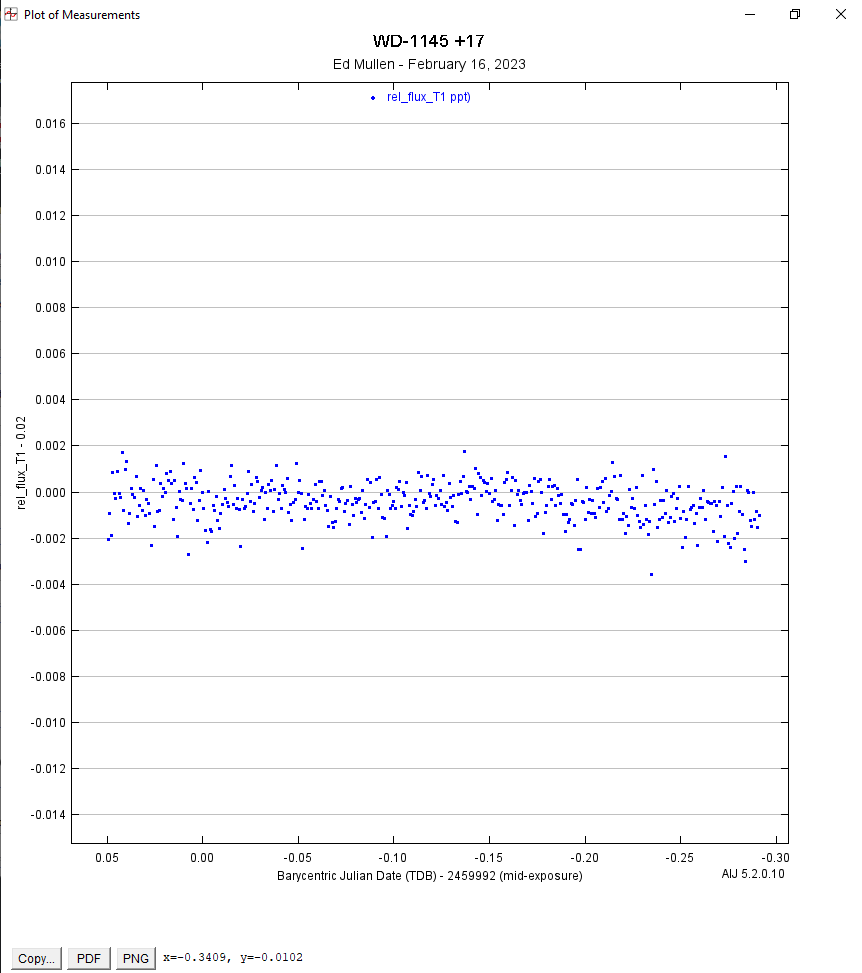
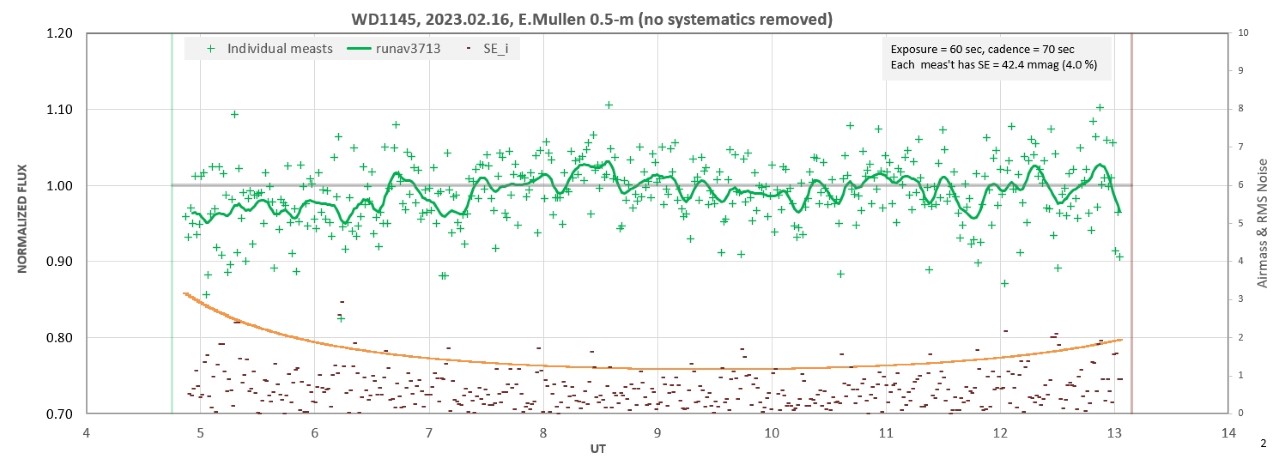
Hi, please see the two plots below. The first plot was made with AIJ using the normal procedure. No detrending, subsetting of comp stars, or outlier removal was done. It is just the basic plot of the data. The second plot was made by a friend who input the Measurements table into an Excel spreadsheet and plotted rel_flux_T1 against time.
If you look at the individual data points in each plot, you can see that there is no correspondence at all between them. It is as if the two plots are working off completely different data files! The difference goes beyond the fact that AIJ subtracts 0.02 from each rel_flux_T1 data point before plotting because that is just a simple linear translation. There is far more difference between the plots. For example, some data points (rel_flux_T1) that show in the AIJ plot do not show up at all in the Excel plot, and some points in the Excel plot do not show up at all in the AIJ plot.
Could you explain why this is happening? It is important because there are several of us working on this team and we exchange Measurment tables all the time and expect that they will plot consistently across different software. Thanks!

