Question about Plot of Measurements

classic Classic list List threaded Threaded
3 messages Options
SCO
Reply | Threaded
Open this post in threaded view
|

Question about Plot of Measurements

SCO
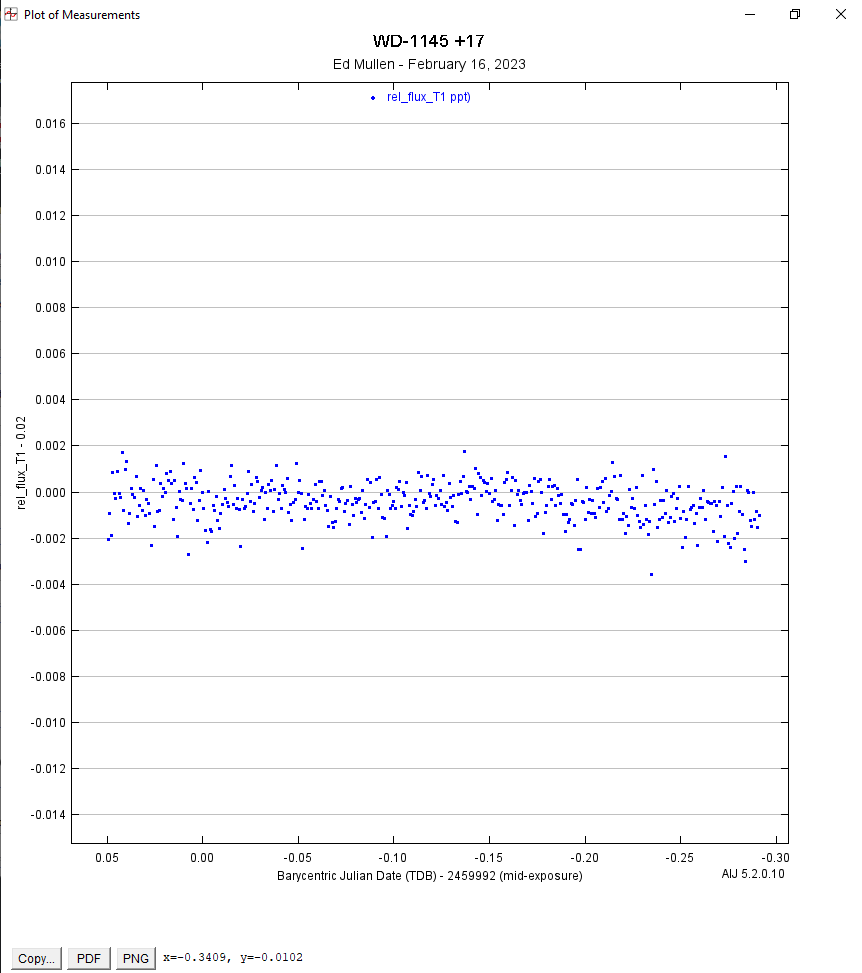
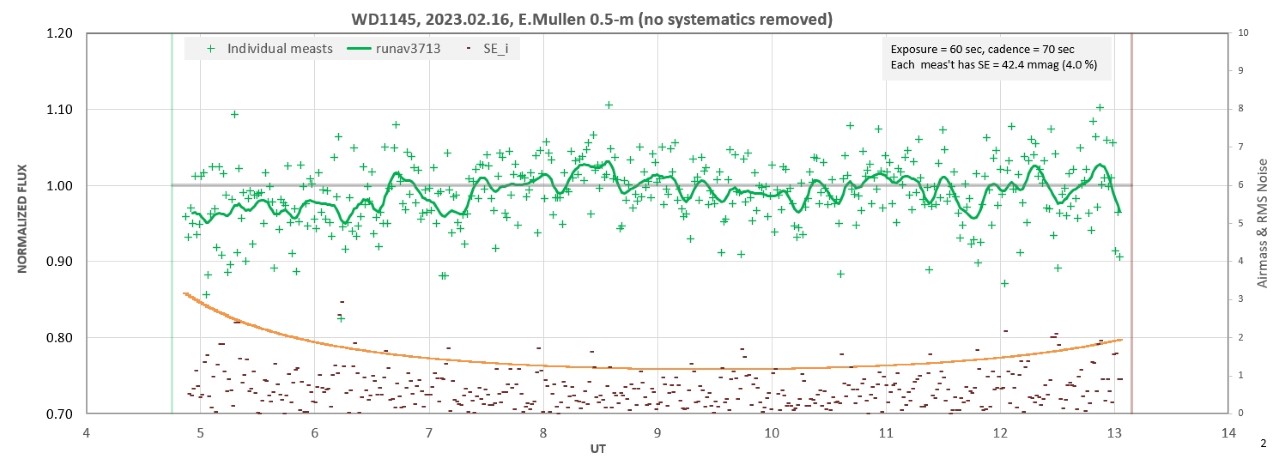
Hi, please see the two plots below.  The first plot was made with AIJ using the normal procedure.  No detrending, subsetting of comp stars, or outlier removal was done.  It is just the basic plot of the data.  The second plot was made by a friend who input the Measurements table into an Excel spreadsheet and plotted rel_flux_T1 against time.

If you look at the individual data points in each plot, you can see that there is no correspondence at all between them.  It is as if the two plots are working off completely different data files!  The difference goes beyond the fact that AIJ subtracts 0.02 from each rel_flux_T1 data point before plotting because that is just a simple linear translation.  There is far more difference between the plots.  For example, some data points (rel_flux_T1) that show in the AIJ plot do not show up at all in the Excel plot, and some points in the Excel plot do not show up at all in the AIJ plot.  

Could you explain why this is happening?  It is important because there are several of us working on this team and we exchange Measurment tables all the time and expect that they will plot consistently across different software.  Thanks!


Sycamore Canyon Observatory
https://scosci.com/
Reply | Threaded
Open this post in threaded view
|

Re: Question about Plot of Measurements

karenacollins
Administrator
It looks like you have something set in AIJ that is making the data be plotted in reverse in AIJ. Notice that the X-axis starts at 0.05 and ends at -0.30. The data also appear reversed in the two plots. I think the only way this can happen is if you are using "Custom X-range" on Multi-plot Main and have set an Xmax value entered that is smaller than Xmin. You may also be chopping off some datapoints from the plot using the Custom setting. I'd recommend making life easier and just use "Auto X-range" instead.
SCO
Reply | Threaded
Open this post in threaded view
|

Re: Question about Plot of Measurements

SCO
Thanks Karen,  Initially the x axis was set up correctly, but somehow it got changed and I did not notice.  Dumb mistake on my part...
Sycamore Canyon Observatory
https://scosci.com/