Possible Bug Report?: NaN Values in Last 50 Rows After “Add New Data Columns to Table from Plot” in AstroImageJ 5.4.1.00

classic Classic list List threaded Threaded
6 messages Options
Reply | Threaded
Open this post in threaded view
|

Possible Bug Report?: NaN Values in Last 50 Rows After “Add New Data Columns to Table from Plot” in AstroImageJ 5.4.1.00

Northscope
Description:
When I use AstroImageJ version 5.4.1.00 to perform transit measurements, I encounter a problem where the last 50 rows of certain columns display NaN (Not a Number). The issue has occurred on two separate machines (one running Windows 11, the other running Ubuntu Desktop 24.04 LTS) and persists even after resetting all AstroImageJ preferences.

Steps to Reproduce:
1. Perform MultiApertureTool measurements to generate the Measurements.xls data table (the issue also appears if I open an existing table).

2. Go to Table → Add new data columns to table from plot -> All data from Curve (Select 1) -> Add New Data (Check all) -> Press Ok.

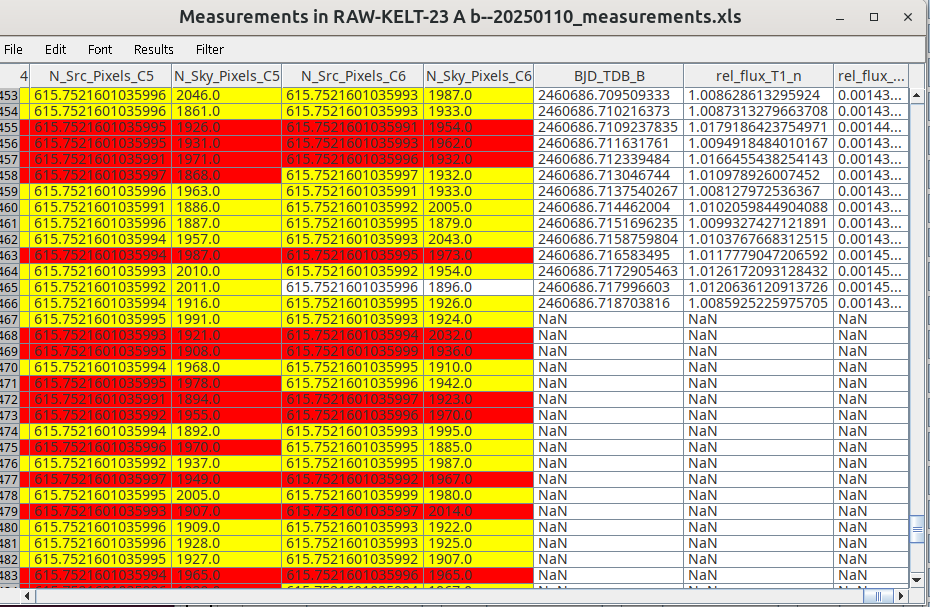
3. Look at the updated Measurements.xls and observe the new columns, such as BJD_TDB_B and the two normalized columns.
Observed Behavior:

The new columns appear, but the last 50 rows in these new columns contain NaN values.

Observed Behavior:

The new columns appear, but the last 50 rows in these new columns contain NaN values.
Measurement.xls

My Workaround:

Copy the last 50 rows (before adding the new columns), then add the new columns, and finally delete any of the rows that show NaN. This workaround has been required for the last five transit measurements.

Additional Information:
Software version: AstroImageJ 5.4.1.00

Operating Systems tested:
Windows 11 (64-bit)
Ubuntu Desktop 24.04 LTS (64-bit)

Attempts to fix:
Restored all AstroImageJ preferences (no change).
Reproduced the error on two different machines.


Reply | Threaded
Open this post in threaded view
|

Re: Possible Bug Report?: NaN Values in Last 50 Rows After “Add New Data Columns to Table from Plot” in AstroImageJ 5.4.1.00

karenacollins
Administrator
Thank you for the thorough report. I have tried to duplicate the problem following your instructions using several measurements table I have on hand for testing, but have so far been unsuccessful. Could you provide us a sample measurementstable and corresponding plotcfg file that we could use to attempt to reproduce the problem? You can send the files to my email address listed at the top of the main forum page.

Karen
Reply | Threaded
Open this post in threaded view
|

Re: Possible Bug Report?: NaN Values in Last 50 Rows After “Add New Data Columns to Table from Plot” in AstroImageJ 5.4.1.00

karenacollins
Administrator
Actually, my email address no longer appears there. Send to karenacollins atata outlook dotdot com.

Karen
Reply | Threaded
Open this post in threaded view
|

Re: Possible Bug Report?: NaN Values in Last 50 Rows After “Add New Data Columns to Table from Plot” in AstroImageJ 5.4.1.00

Northscope
Thanks.
It is sent.

Regards,
Martin
Reply | Threaded
Open this post in threaded view
|

Re: Possible Bug Report?: NaN Values in Last 50 Rows After “Add New Data Columns to Table from Plot” in AstroImageJ 5.4.1.00

karenacollins
Administrator
Thank you! I see the problem. In Multi-plot Main, under Trim Data Samples, the Tail value is set to 50. This causes multiplot to ignore the last 50 points. You'd need to normally set Tail to 0 process all of the data points. However, in the measurements table you sent, I noticed that the last 4 rows in the data are non-standard (labeled Mean, SD, Min, Max). You may want to remove those rows or set the Tail value to 4 (you'd still get 4 NaNs at the bottom).

By the way. there is a shortcut to access the "Add new data columns" functionality in Multi-plot Y-data. If it helps, you can simply click on the "New Col" icon on the left hand side of the row you are interested to work with.

Karen
Reply | Threaded
Open this post in threaded view
|

Re: Possible Bug Report?: NaN Values in Last 50 Rows After “Add New Data Columns to Table from Plot” in AstroImageJ 5.4.1.00

Northscope
Thank you for the answer. That makes perfect sense.

The only concern is that when I use “Save All” from the multi-plot main, I would expect the last 50 data points (the “tail of 50”) to also affect the saving of **Measurement.xls**, since that’s the file I use when creating an AASVO report. In that scenario, I probably wouldn’t want to include those 50 fields at the end.

But I’m learning as long as I keep trying! :-)

Best Regards,
Martin