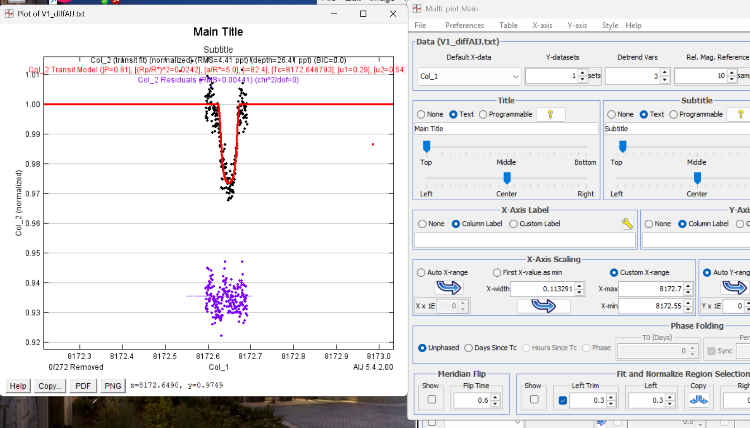
I feel that this must have an obvious solution - I am currently trying to plot normalized magnitude vs time for an exoplanet transit. For some reason the x-axis of the graph spans a much larger time period than the actual transit data, and when I try to change the x-axis to zoom in on the transit the x-axis will not change.
I've included a screenshot of the plot and the x-axis scaling options on the multi-plot window.
