Plot seeing profile

classic Classic list List threaded Threaded
5 messages Options
guy
Reply | Threaded
Open this post in threaded view
|

Plot seeing profile

guy
Hi,
I am trying to use AIJ on solar images to obtain a measurement of the solar limb darkening function. I use the "Plot seeing profile" menu : it seems to display the normalized flux of each pixel (blue squares) as a function of the distance from the centroid (i.e. the center of the solar disk, in my case).
I have a few issues :
1/ Why is the x-axis labeled Radius [inches] and not Radius [pixels] ?
2/ Where can I find the mathematical expressions for the 4 quantities HWHM, Radius, Back> and <Back ?, and how AIJ calculates the fit shown as a Magenta line ? I quickly went through the user guide and the Collins et al papers but did not found this information.
3/ Is there a way to get the quantities plotted as Blue squares and Magenta line as an x-y ASCII file ?

Thank you for your attention
Guy
Reply | Threaded
Open this post in threaded view
|

Re: Plot seeing profile

karenacollins
Administrator

Hi Guy,

1) On my machine, the x-axis is indeed labeled as Radius [pixels]. An example is shown below. Could you post an example from your machine that shows inches? Which version of AIJ are you running? What clicks or menu items did you use to initiate the Seeing Profile plot?

2) This is discussed in appendix A.4 in the paper. HWHM is just FWHM/2. HWHM is just the x-axis point where the magenta line crosses 0.5 on the y-axis. Radius is 1.7 x FWHM, Back> is 1.9 x FWHM,, <Back is 2.55 x FWHM. These radii give an equal number of pixels in the aperture and sky-background annulus. The magenta curve is not actually a fit. To draw the line, AIJ first bins all of the radial measurements into one pixel wide bins. Then line segments are drawn from each binned point to the next to create the overall magenta curve.

3) Yes, click the "List" button at the bottom left of the plot. The blue points are in columns X0, Y0. The points that define the magenta line are in columns X1, Y1.

Karen
guy
Reply | Threaded
Open this post in threaded view
|

Re: Plot seeing profile

guy
Hi Karen,

Thanks a lot for your answer,

1) I run AIJ 3.2.0 on Linux and I think I found the reason for the Radius [inches] issue : when I open a CR2 Canon Raw image (through a dcraw plugin) I get "inches", and when I open a fits image such as your WASP-12b, I have "pixels" on the x-axis (no big deal anyway)

2) Oops ! you are right, the info I requested was already in the A.4 in your paper. I understand that 1.7**2 = 2.55**2 - 1.9**2, but what happen if I change the settings, do I have to maintain a strict equal number of pixels in the aperture and sky-background annulus ?

3) Yes "List" works, even on an image from a CR2 file : see image below, which is a profile of an uncalibrated and saturated star image with noisy surroundings, in that case I got a file with ~7500 pixels listed. Unfortunately "List" does not work on an image of the solar disk which has a huge FWHM of 1600 pixels: the plot is displayed, after quite a long time, but when I click "List" AIJ hangs. I understand it would produce a file with several million lines. Is it possible to get only the Magenta line in x-y form (since it is the quantity I am interested in and would be quite a small file)?

Regards,
Guy
Reply | Threaded
Open this post in threaded view
|

Re: Plot seeing profile

karenacollins
Administrator

Hi Guy,

1) That's interesting. I'll take a look when I get a chance, but as you mentioned, the units in the label doesn't seem like a major issue at the moment.

2) You can change the aperture settings as needed. Those values are just recommendations.

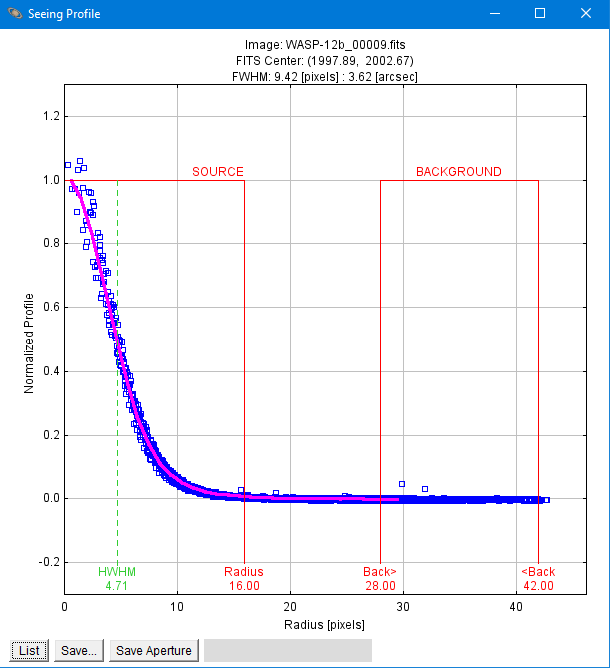
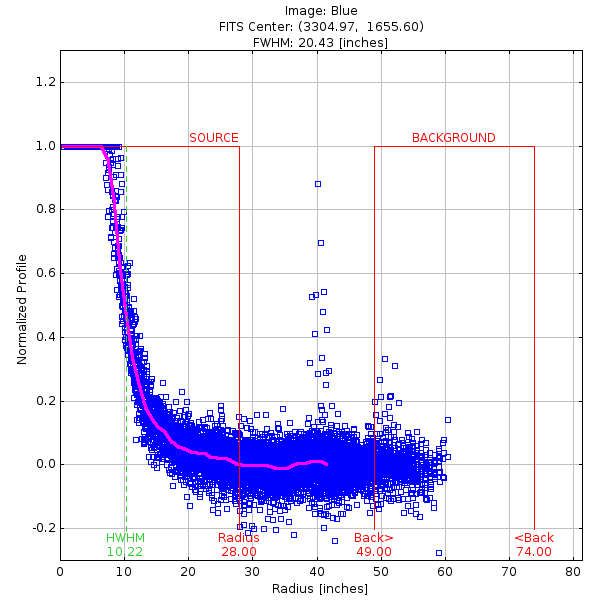
3) Yeah, the Seeing-Profile tool was really designed to analyze smaller objects. With that tool, there is not currently a way to separately extract the binned data. Have you tried the "Static line profile" tool? It doesn't do a radial profile (which analyzes the full disk around a point and results in the tons of data that you mentioned), but simply extracts the data corresponding to a line (or box) that you draw in the image. If that would work for you, then follow these steps:

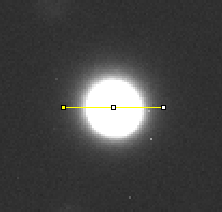
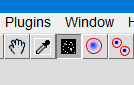
-Click the line tool on the AIJ toolbar

-With a mouse click and drag, draw a line where you want to measure in the image. Re-position the line as need using the end points or middle point.

-Use Image_Display_Menu->Analyze->Plot static line profile


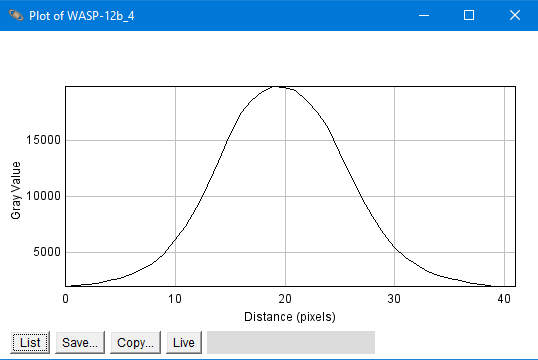
-Click "List" to see the table and save it to disk.

-**Important**: Return to AIJ mode by clicking the Astronomy_Tool icon on the AIJ toolbar.


-You can also use a box instead of a line if you want to average a few values across the width of the box.

I hope this can help with what you are trying to do for now.

One more thing to check in case you really need the Seeing Profile to work. I suspect the large table could be using up all of the AIJ memory (or you just need to wait a really long time for the table to display). Can you increase the memory available to AIJ? You probably shouldn't go above 75% of your physical system memory. The setting is at AIJ_Toolbar->Edit-Options-Memory and Threads. You will need to restart AIJ after you change the memory setting.

Karen
guy
Reply | Threaded
Open this post in threaded view
|

Re: Plot seeing profile

guy
OK, Karen, according to your advice, I used "Plot static line profile", it is good enough for what I am trying to do.
Thank you also for bringing the memory settings issue to my attention.

Regards,
Guy