Plot of true magnitude against time

classic Classic list List threaded Threaded
4 messages Options
Reply | Threaded
Open this post in threaded view
|

Plot of true magnitude against time

Bill Tschumy
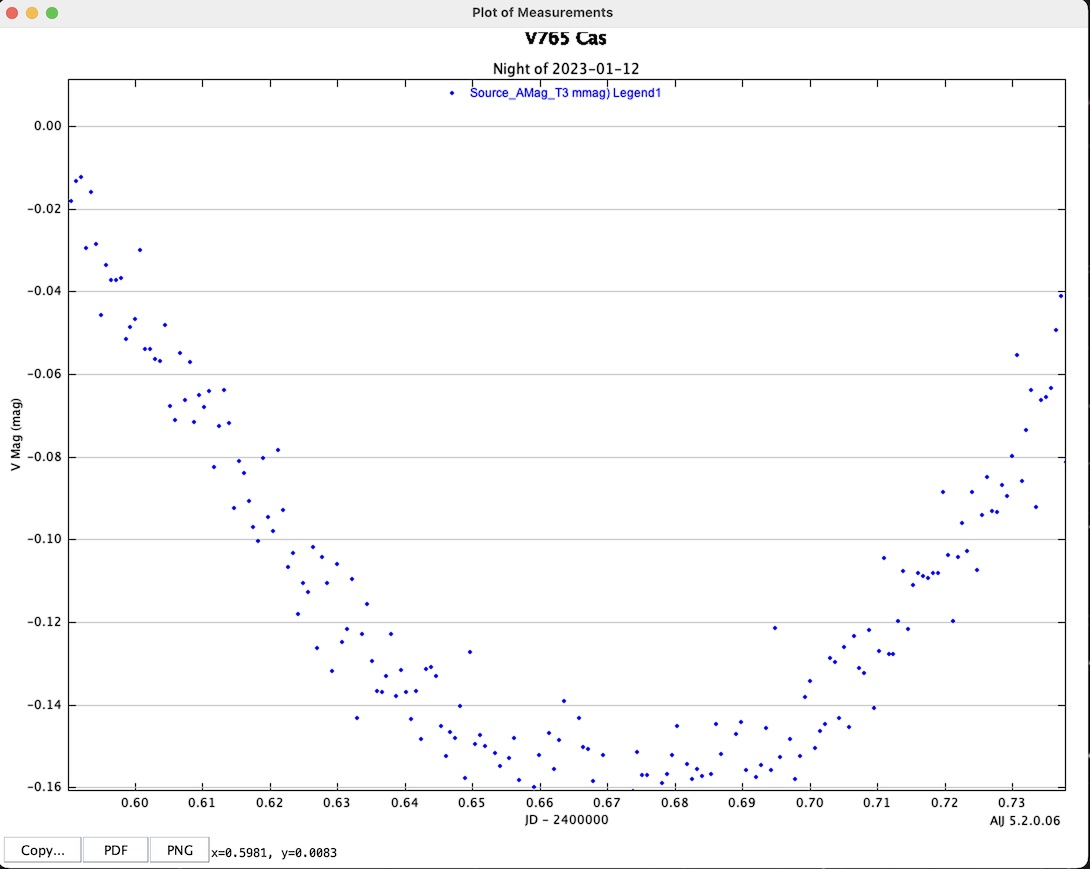
You would think this would be simple but I've spent an hour trying various things to get is to happen.  I'd like a plot of my target star's measured magnitude against JD.  However, it always displayed as a deviation from its mean, max or min (at least I think that is what it is doing.
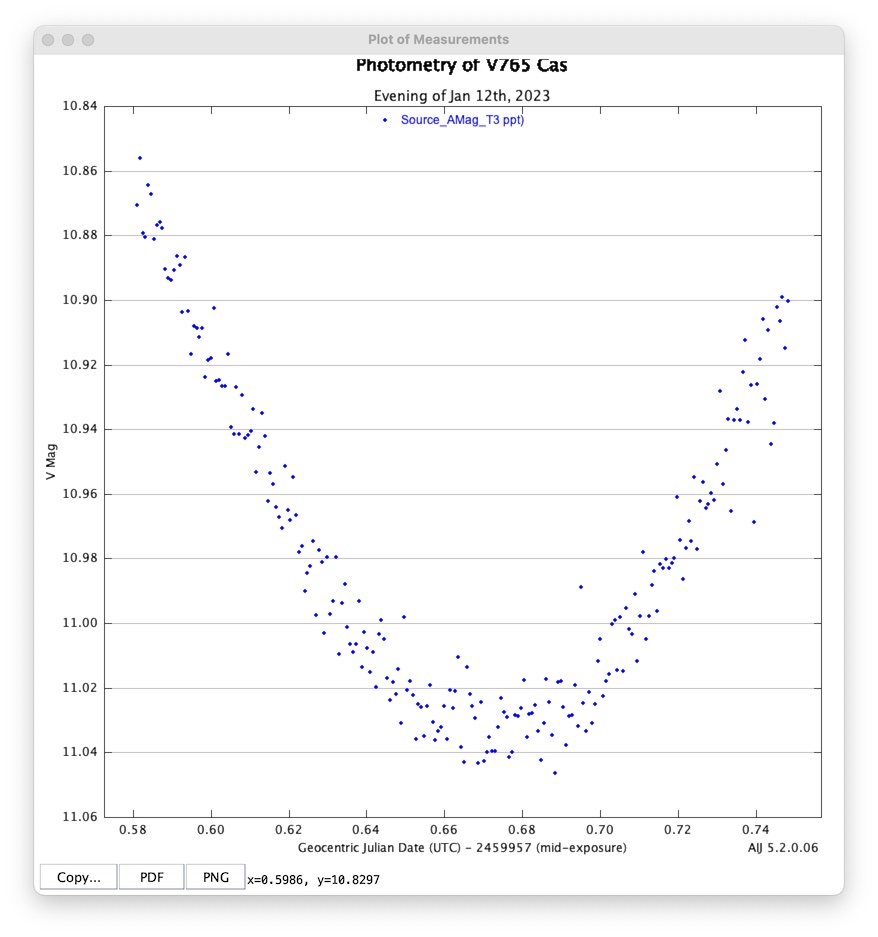
Here is my plot:


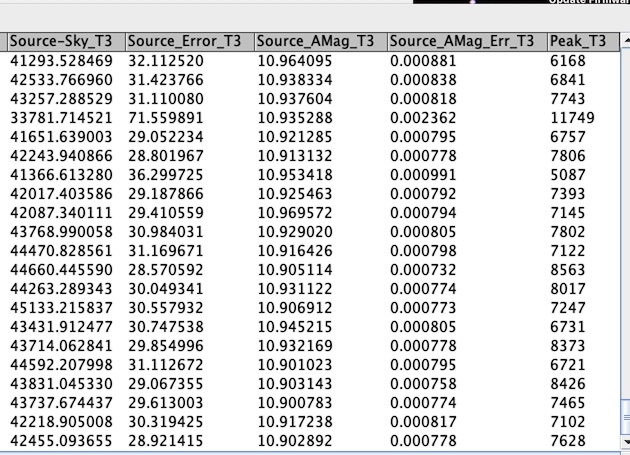
Here is my measurement showing I do have magnitudes in Source_AMag_T3


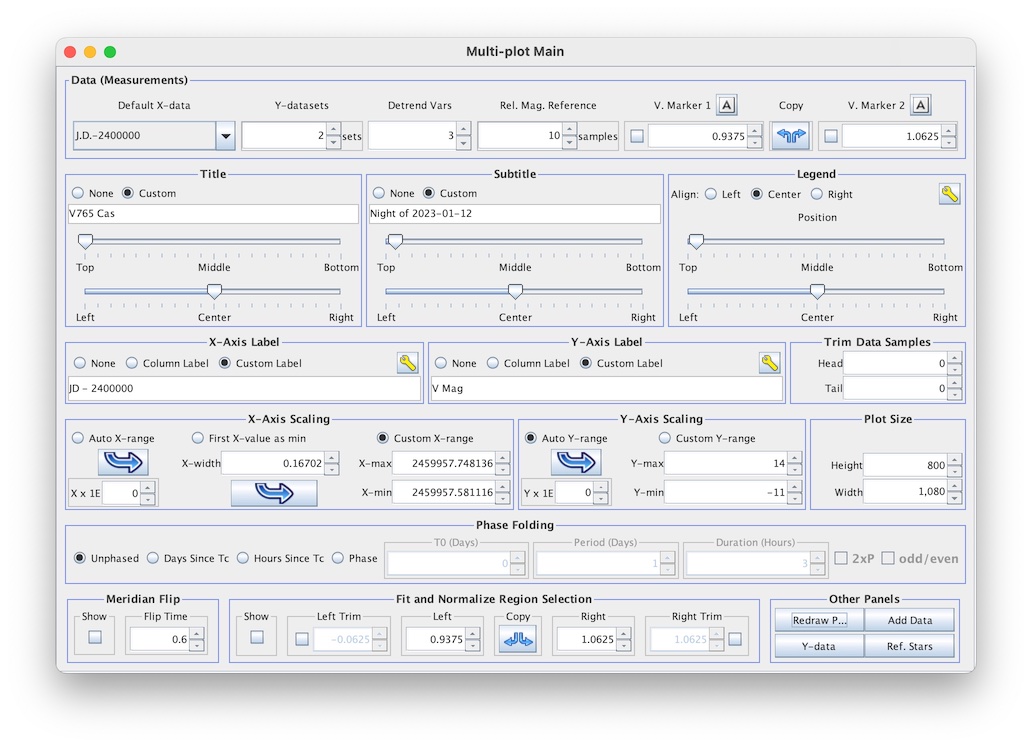
Here is my Multi-plot Main:


And here is my Multi-plot Y-data


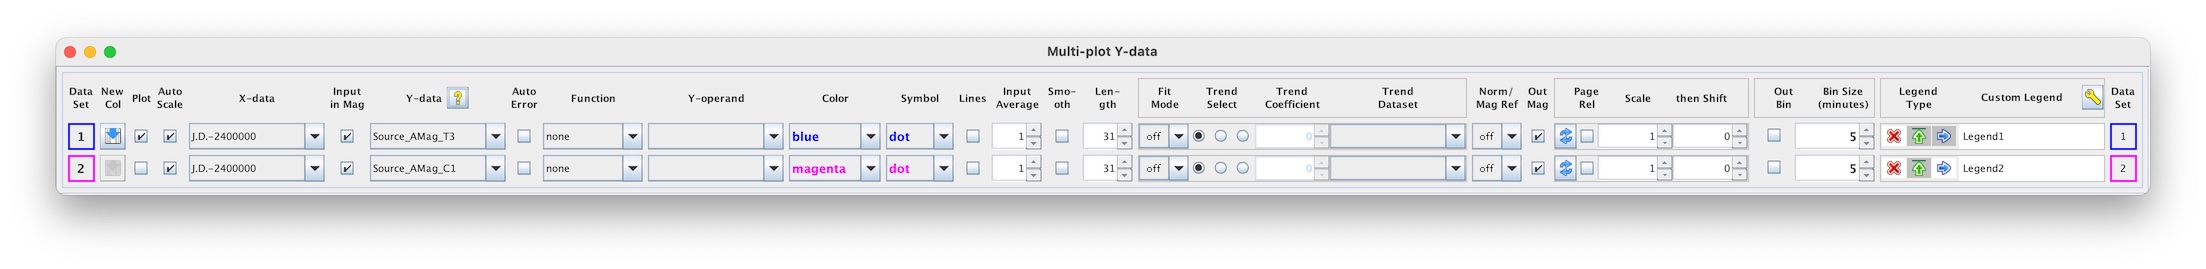
Could someone please explain what to change to turn the normalization(??) off?

Bill
Reply | Threaded
Open this post in threaded view
|

Re: Plot of true magnitude against time

Bill Tschumy
Ok, I'm making progress.  Looks like having "Input in Mag" and "Output Mag" checked was the main issue.

I was also able to reverse the order of the Y axis (so down  is dimmer in magnitude) by setting a Custom Y-range wit the min and max reversed.  It would be nice if you could use Auto-scaling and reverse the direction but I couldn't find a way to do this.

Here is my new plot:


I would like to fit a polynomial to the data.  I found the "Plugins > Filters > Fit Polynomial" plugin, but I couldn't get it to do anything useful for me.  If this is what I should be using, could someone give me some pointers?

I did find this documentation but if wasn't helpful to me:  https://imagejdocu.list.lu/plugin/filter/fit_polynomial/start
Reply | Threaded
Open this post in threaded view
|

Re: Plot of true magnitude against time

karenacollins
Administrator
Regarding inverting the Y-axis, go to multi-plot main > Y-axis > Invert Y-axis.
Reply | Threaded
Open this post in threaded view
|

Re: Plot of true magnitude against time

karenacollins
Administrator
Regarding fitting the data with a polynomial, I'm not sure if the plugin would work with an AIJ measurements table (but try and let us know here if you do). Probably the easiest way to do the fit you want is to load the measurements  table into Excel or Google Sheets (as a tab-delimited file) and use the spreadsheet fitting tool to fit the curve with the polynomial you want.