Perform Differential Relative Photometry on a Time Series of Images
Perform Differential Relative Photometry on a Time Series of Images
|
Administrator
|
See chapter 10 in the latest user guide here:
http://www.astro.louisville.edu/software/astroimagej/guide/AstroImageJ_User_Guide_2.1.4.pdf |
|
This post was updated on .
Hi Karen,
I was using IRIS for variable star photometry. But data analysis by IRIS is quite lengthier so now I'm learning to use astroimagej. While performing multi-aperture photometry I got stucked that there is no change in x-axis of plot i.e. time. Where should I add time in the graph. May be I missed something. Please help me in this. Regards, Ganesh Pawar |
Re: Perform Differential Relative Photometry on a Time Series of Images
|
Administrator
|
Hi Ganesh,
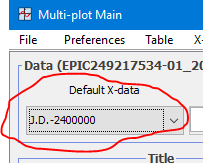
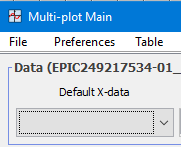
The setting for the default time (x-axis) data column is at the top left of the Multi-Plot_Main panel. Try "J.D.-2400000" first:  Also, make sure the X-axis and Y-axis scaling are set to "Auto" on the same panel:  If that doesn't give you a plot of your data, set the Default X-axis column to "blank" like this:  which will force the Y-axis samples to be plotted at evenly spaced distances. This setting is not what you want as a final plot, but should give you a plot. Then we can figure out why the usual time columns are not working. Karen On 5/24/2018 1:00 AM, Ganesh [via AstroImageJ] wrote:
Hi Karen, |
|
Hi Karen,
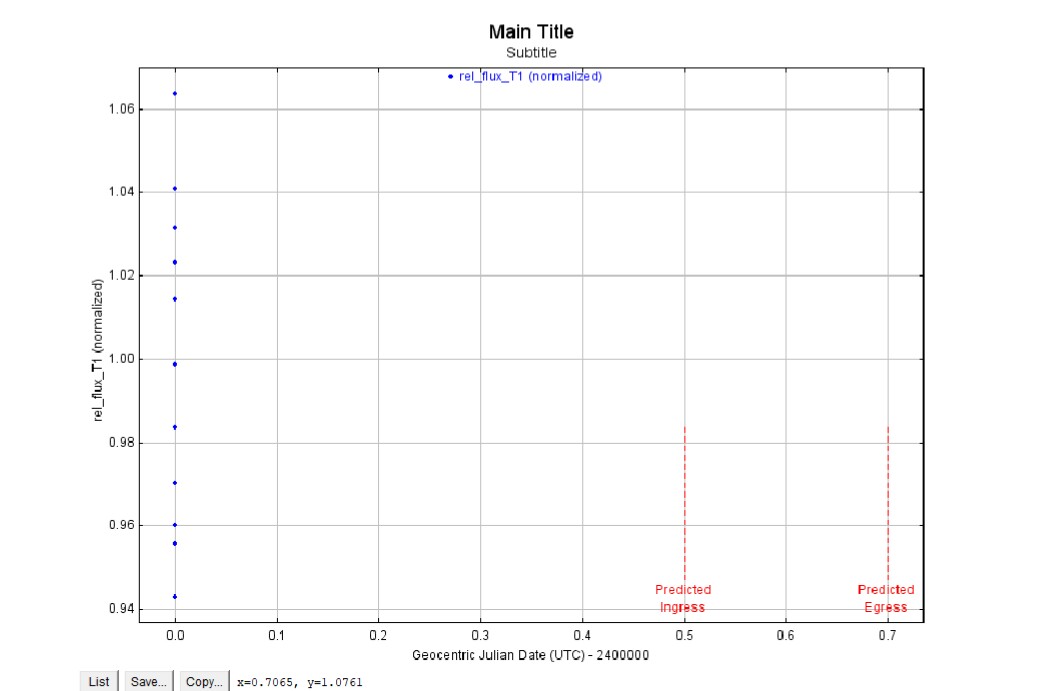
I've tried as you said but still no success yet & now it's showing mag as +1. But it's actually between 9.2 to 9.4.  Please look into this. Regards, Ganesh Pawar |
Re: Perform Differential Relative Photometry on a Time Series of Images
|
Administrator
|
Hi Ganesh,
I think you are still having trouble with your time axis data column. However, you should disable V.Marker 1 and V.Marker 2 at the top right of Multi-plot Main. Those produce the red dasked vertical lines and are included in the x-axis autoscaling. Nevertheless, it appears that all of your x-axis data column values are zero. You can look at the selected data column values in the measurements table display to see the numbers. As I mentioned previously, you can plot the photometry sequentially by selecting the "blank" data column for the x-axis. The values on the y-axis are centered around 1.0 because you apparently have a normalization mode turned on in the Multi-plot Y-data panel for that plot row. All of the details of plotting are more than I can go into here. However, there is a really nice and detailed step-by-step manual that was put together by an AAVSO lead member, Dennis Conti, here: http://www.astrodennis.com at the first link on the page. Dennis also provides some tutorial example files to use to go through the step-by-step guide the first time. I think if you could go through that exercise, it would give you all of the insight that you need to fully utilize AIJ's photometry and plotting capabilities. Once you have been through that exercise, lets' pick back up on any remaining questions you may have. Karen On 5/25/2018 6:06 AM, Ganesh [via AstroImageJ] wrote:
Hi Karen, |
«
Return to How to accomplish specific tasks in AstroImageJ
|
1 view|%1 views
| Free forum by Nabble | Edit this page |


