Output an AIJ Light Curve data subset for input to ExoFAST or other global modeling tools

Output an AIJ Light Curve data subset for input to ExoFAST or other global modeling tools

Administrator
|
This post was updated on .
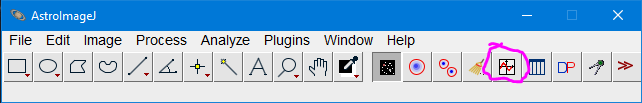
If the dataset of interest is not already open in AIJ, load the corresponding "measurements" table and associated .plotcfg file. The easiest method to load the two files into AIJ is to open Multi-Plot first (see image below) from the AIJ Toolbar and then drag and drop the two files onto one of the Multi-plot settings panels. If you are extracting TFOP data from ExoFOP, download the "measurements" table (which may have a file suffix of .tbl, .txt, or .xls, all of which are simple tab-delimited files that contain all of the photometric data, including reference star data and detrending parameters) and the associated .plotcfg file (which will set up the light curve plotting, references stars, detrending, and fitting the same way the observer submitted the data). Then load the measurements table and then .plotcfg files into AIJ. Be sure you are logged into ExoFOP using your TFOP associated account to see all files.
|
Re: Formatting AIJ Light Curves for Input to EXOFAST
|
Administrator
|
This post was updated on .
Follow these instructions to extract an AIJ light curve from a measurementsTable and format it for input to EXOFASTv2 or other global modeling tools.
First, make sure there is a BJD_TDB column in the measurements table, and that it has actual numbers (not NaNs). If the table has numeric BJD_TDB data, make sure you trust those values. If you are not sure of the validity of the BJD_TDB timestamps, or if the BJD_TDB column does not exist, or if it exists but has NaN values, you will need to create BJD_TDB values following this post. The AIJ Reference Star panel may be used to change the stars that are included in the reference ensemble to see the effect on the target star differential light curve. Generally, a comp star ensemble should be selected that minimizes the light curve residuals (see RMS box in fit panel or light curve plot legend). 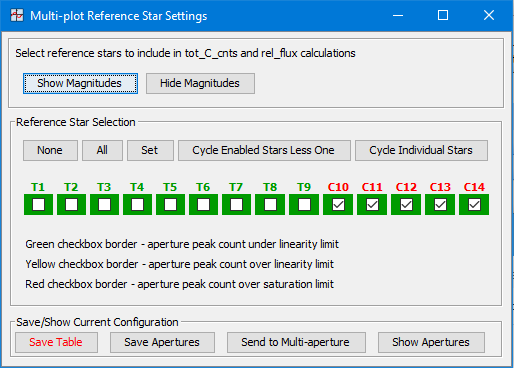
The light curve fitting panel may be used to examine the influence of different detrend parameters on the light curve. Only select detrend parameters that reduce the BIC value by at least two (see the BIC box in the fitting panel). For full transits with baseline on both ends, generally choose only one parameter, or at most two. Airmass is the detrend parameter that most likely influences a light curve. For partial transits, detrending may produce unreliable results, so detrend with caution. For partials, it is probably reasonable to include only one detrend parameter, if any at all. Interesting detrending parameters for ground-based data might be: Airmass (AIJ column name is generally AIRMASS, but may vary if extracted from fits header) Time (AIJ column names are BJD_TDB, or JD_UTC ) FWHM (AIJ column name is Width_T1) Sky Background (AIJ column name is Sky/Pixel_T1) X-centroid position of target star (AIJ column name is X(FITS)_T1) Y-centroid position of target star (AIJ column name is Y(FITS)_T1) Total comparison ensemble counts (AIJ column name is tot_C_Cnts) or any AIJ column may be used for detrending (See Collins et al. 2017 for full descriptions of data columns) 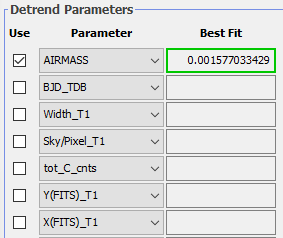
Next you need to save the normalized flux and error back to the measurements table. To do so, display the light curve with no fitting and no detrending and normalized using out-of-transit data only. You should also generally set "Bin Size" to 1 for modeling. You must have "Scale" set to 1 and "Shift" set to 0 (or ensure that "Remove scale..." and "Remove Shift..." are enabled as shown in the "Add new columns to table" panel below). The AIJ Multi-plot Y-data settings should look like this: 
On the Multi-Plot Main panel, set the "Left and "Right" markers at the start of ingress and end of egress, respectively, as shown below (or use the shortcuts [control]-left-click to place the "Left" marker at ingress directly in the plot and [control]-right-click to place the "Right" marker at egress directly in the plot). 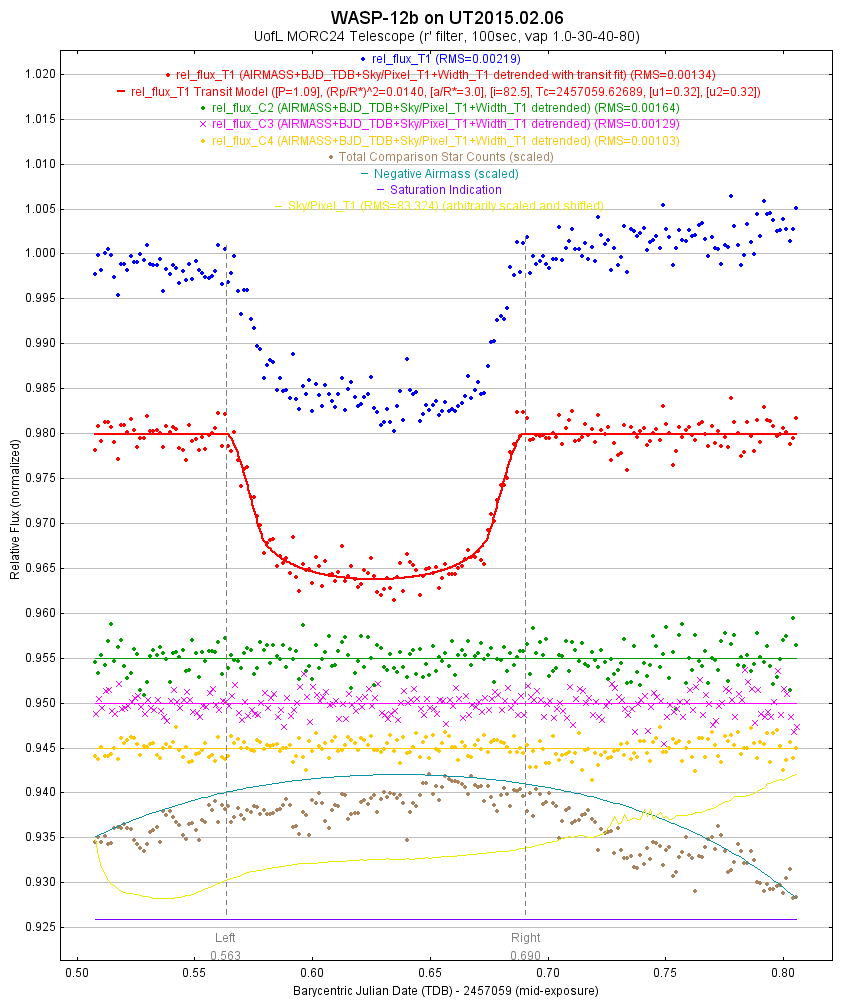
Next, click the "New Col" button: 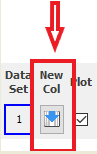
which saves the normalized flux and error back to the measurements table in new columns. You will see this panel open. 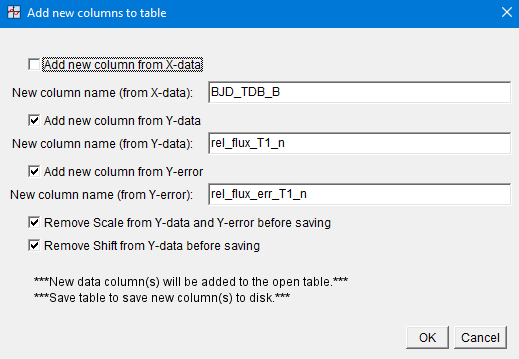
Make sure the panel is setup as shown above. Leave the "Add new column from X-data" unchecked. Now click "OK" to save the new columns to the measurements table in memory. The Multi-plot panels may flash off and back on while the new columns are being added to the table. The newly created normalized data can now be selected for output in the Multi-plot Main->"Save data subset to file.." dialog as described below. If you want to retain the new data columns in the measurements table for future use (a good idea), be sure to save the updated measurements table using the option in the Multi-plot Main > File menu (or from the measurements table display panel). Now use AIJ's Multi-plot->File->"Save data subset to file..." option. The following panel will open: 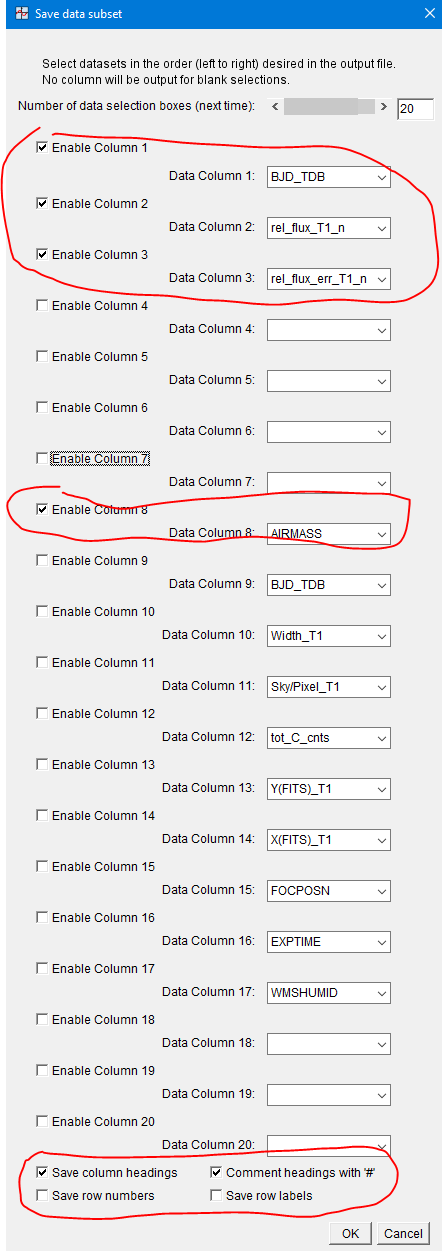
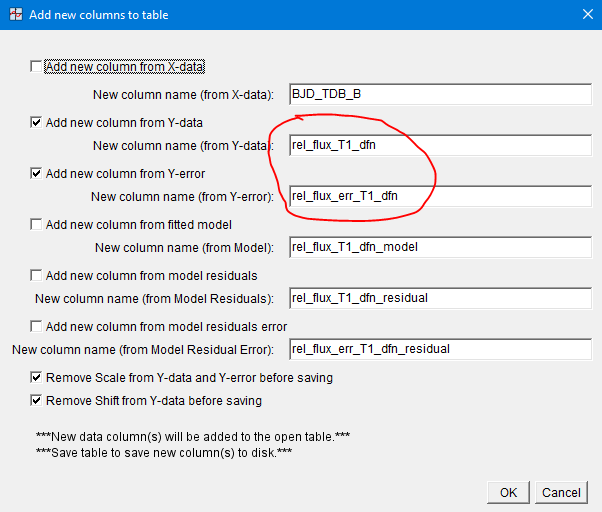
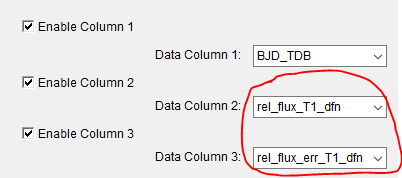
Set it up as shown above (i.e. only 4 datasets selected - in the order shown - and the rest deselected or blank). Blank or disabled data columns are ignored when AIJ creates the output file, so blank or disabled columns can be included or removed from the panel at any position without affecting the contents of the output file. If additional detrend columns are to be included in the global fit, add them using higher available Data Columns (e.g. data columns 9, 10, 11, etc. in the example above). The data columns will be output left to right in the order selected in the data subset panel (top to bottom). If your modeling software uses headers to identify column contents, then enable "Save column headings" and "Comment headings with'#'" at the bottom of the panel as shown above. If you are unsure, enable these options anyway since the header line can be easily deleted with a text editor later, if needed. However, be sure to DISABLE the "Save row numbers" and "Save row labels" options, as shown above. Note that additional Data Column settings can be included in the panel by changing the setting at the top of the panel, then clicking on cancel, then reopening the panel. A recommended file naming strategy is to use the same name as the measurementsTable file, except remove "measurements" and use the extension ".dat". It is also a good idea to include the column contents in the filename, especially if the header line is disabled. An example would be: TIC12345678_20210520_LCO-CTIO-1m0_ip_bjd-flux-err-airmass.dat. However, you can use whatever name you prefer. If your modeling software does not implement simultaneous detrending, or if for any reason you prefer to output an AIJ fitted, detrended, and normalized version of light curve, then display the fitted, detrended, and normalized light curve as shown in red dots and lines in the plot above. Below is an example Multi-plot Main Y-data panel set-up. Click the corresponding "New Col" button when the desired light curve is displayed in the plot. The panel below will show. Generally, the default settings shown will be what you need. Then in the "Save data subset" panel, output columns BJD_TDB, rel_flux_T1_dfn, and rel_flux_err_T1_dfn. When outputting an AIJ detrended data subset file, generally no detrending parameters are needed in the output file, but they can optional be included too if desired. 
When the data subset file has been saved, open it using a text editor and verify that the first column looks like BJD values, the second column has values near 1.0 (i.e. the normalized relative flux), the third column has values near zero (i.e. the photometric uncertainties), and that the fourth column has values somewhere in the range 1 to ~3 (i.e. airmass). Below is an example of how the .dat file should appear. Karen TIC12345678_20210520_LCO-CTIO-1m0_ip_bjd-flux-err-airmass.dat #BJD_TDB rel_flux_T1_n rel_flux_err_T1_n AIRMASS 2458451.703580 1.004579 0.0040 1.527173 2458451.704413 1.004286 0.0040 1.524040 2458451.705247 0.999026 0.0040 1.520934 2458451.706080 1.002904 0.0040 1.517877 2458451.706925 0.999362 0.0040 1.514765 2458451.707758 1.001606 0.0040 1.511730 2458451.708592 1.000078 0.0040 1.508709 2458451.709425 1.001872 0.0040 1.505724 2458451.710258 0.998540 0.0040 1.502774 2458451.711092 1.003167 0.0040 1.499826 2458451.711925 1.003072 0.0040 1.496909 2458451.712758 1.000731 0.0040 1.494033 2458451.713592 0.999767 0.0040 1.491165 2458451.714425 0.997559 0.0039 1.488318 2458451.715247 1.003427 0.0040 1.485522 2458451.716080 1.000925 0.0040 1.482728 2458451.716913 1.001676 0.0040 1.479956 2458451.717747 1.003251 0.0040 1.477207 2458451.718580 1.005444 0.0040 1.474483 2458451.719413 1.002899 0.0040 1.471779 2458451.720247 0.997819 0.0039 1.469100 2458451.721080 0.999109 0.0040 1.466440 2458451.721914 1.000634 0.0039 1.463779 2458451.722747 1.002378 0.0040 1.461165 2458451.723580 1.005293 0.0040 1.458575 2458451.724414 0.999361 0.0039 1.456006 2458451.725247 0.999872 0.0039 1.453450 2458451.726080 0.997623 0.0039 1.450928 2458451.726914 1.003409 0.0040 1.448416 2458451.727747 1.000366 0.0039 1.445919 2458451.728580 1.005416 0.0040 1.443442 2458451.729414 1.003061 0.0040 1.441003 2458451.730247 1.003531 0.0040 1.438577 2458451.731092 1.005363 0.0040 1.436160 2458451.731925 1.002385 0.0040 1.433782 2458451.732759 1.001533 0.0040 1.431418 2458451.733592 1.002717 0.0040 1.429064 2458451.734425 1.002029 0.0040 1.426752 2458451.735259 1.003392 0.0040 1.424458 2458451.736092 1.001414 0.0040 1.422177 2458451.736925 1.004863 0.0040 1.419917 2458451.737759 1.000946 0.0040 1.417677 2458451.738592 1.003669 0.0040 1.415458 2458451.739425 0.998945 0.0039 1.413268 2458451.740247 1.003906 0.0040 1.411098 2458451.741081 0.999662 0.0039 1.408939 2458451.741925 1.000405 0.0040 1.406773 2458451.742759 0.999097 0.0039 1.404664 2458451.743592 1.002431 0.0040 1.402563 2458451.744425 1.001272 0.0040 1.400484 2458451.745259 0.997020 0.0039 1.398424 2458451.746092 1.001026 0.0040 1.396384 2458451.746926 0.999905 0.0039 1.394355 2458451.747759 0.997718 0.0039 1.392352 2458451.748592 1.001672 0.0040 1.390361 2458451.749426 0.998008 0.0039 1.388404 2458451.750282 1.004845 0.0040 1.386399 2458451.751115 0.997569 0.0039 1.384474 2458451.751960 0.998629 0.0039 1.382552 2458451.752794 1.002688 0.0040 1.380666 2458451.753615 1.004379 0.0040 1.378806 2458451.754449 0.999164 0.0039 1.376956 2458451.755282 1.002317 0.0040 1.375125 2458451.756115 1.002092 0.0040 1.373305 2458451.756949 0.998085 0.0039 1.371511 2458451.757782 0.998999 0.0039 1.369735 2458451.758627 0.997935 0.0039 1.367954 2458451.759460 1.002859 0.0039 1.366208 2458451.760294 0.999424 0.0039 1.364487 2458451.761127 1.000899 0.0039 1.362784 2458451.761960 0.997522 0.0039 1.361085 |
Re: Formatting AIJ Light Curves for Input to EXOFAST
|
|
Hi Karen
I have been using AIJ and Exofast extensively over the last few years and I'm very interested to understand a little more why you suggest not detrending the data in AIJ, I presume the preference is to detrend in Exofast? If this is the case is there a way to extract data columns for other detrend parameters, such as meridian flip, so these can be included in the Exofast detrend as well? Having read the information on how AIJ undertakes detrending (P13 of your 2017 paper) am I right in understanding the detrending fits are linear only? Many thanks Mark Salisbury |
Re: Formatting AIJ Light Curves for Input to EXOFAST
|
Administrator
|
Hi Mark,
If you are running EXOFAST MCMC transit model fits, then you should detrend in EXOFAST as part of that model fit. If you are doing a simple best fit in AIJ for your final result, it's probably fine to also detrend in AIJ. To output data from AIJ to import in EXOFAST, follow this post: http://astroimagej.1065399.n5.nabble.com/Formatting-AIJ-Light-Curves-for-Input-to-EXOFAST-td1109.html You can also export meridian flip data as part of the above process. In AIJ, if you select a detrend parameter one time, then linear detrending is implemented. If a detrend parameter is selected two times, then quadratic detrending is implemented, etc. It is my understanding that only linear detrending is available in EXOFAST. Karen On 4/30/2019 3:06 AM, Mark Salisbury [via AstroImageJ] wrote:
Hi Karen |
«
Return to How to accomplish specific tasks in AstroImageJ
|
1 view|%1 views
| Free forum by Nabble | Edit this page |