Multiplot magnitude issue


|
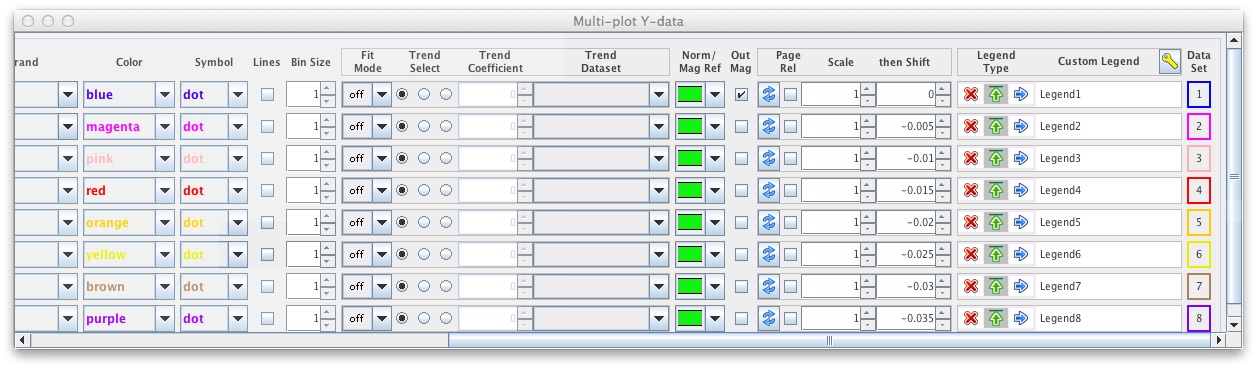
I'm having a little bit of a problem with getting the multiplot graph to have the correct y-values. The issue is that instead of plotting the actual value of the magnitude of the target star (which is around magnitude 11) the graphing routine insists on plotting what appears to be the difference in magnitude from some reference point (I'm not sure exactly what the "0" reference point is), with the y-axis running from -0.25 to .35. The data shows correctly in the measurements table column "Source_AMag_T1".
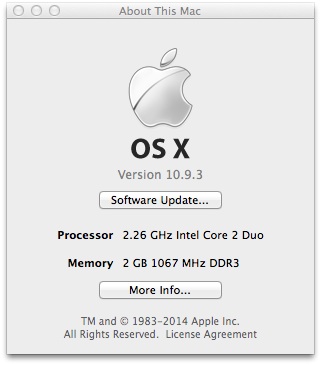
A curious point is this - I'm working with a student who is using a MacBook, running MacOSX 10.9.3 to process the data (consists of 220 measurements). When I process the same set of data on my MacBook Pro (MacOSX 10.10.3 and more RAM), with (I think) all the settings the same, I end up getting a graph with the actual values of the magnitude (y-axis runs from 11.25 to 10.65).
So, I'm not sure why the MacBook version doesn't show the actual magnitude values, and I'm not sure why the MacBook Pro works and the MacBook doesn't. The AstroImageJ version and Java version is the most current one. I'm attaching screen shots of all (I think) of the relevant windows - let me know if you need more info.
      One more thing - the tooltips help is really helpful - it's about the only place some of the functions are described. Is there anyway to make the tooltips hint show for a longer time? There's barely enough time to read some of the hints before they disappear, and it's way to short for those of us trying to figure out the meaning of the hint.
Thanks.
One more thing - the tooltips help is really helpful - it's about the only place some of the functions are described. Is there anyway to make the tooltips hint show for a longer time? There's barely enough time to read some of the hints before they disappear, and it's way to short for those of us trying to figure out the meaning of the hint.
Thanks.
|
|
Administrator
|
Hi, I see that a little confusion has been introduced into some of
the GUI labels with the addition of the ability to enter absolute
magnitudes. The measurements table column "Source_AMag_T1" is of
course already in absolute magnitude, so if you plot it directly
(uncheck the "Input In Mag" and "Out Mag" options, disable
normalization, disable detrend/fitting - which you have done, set
"Scale"=1, and "Then Shift"=0), you should see the absolute
magnitude value plotted without the values being changed. I am
guessing that these options are deselected/disabled on the computer
that is displaying the absolute magnitude values properly.
I'll add more details on the usage of "Input In Mag" and "Out Mag" here: If "Input In Mag" is selected, the magnitude values in the measurements table column are converted to flux based on the first n data values, where n is defined on the Multi-plot Main panel here 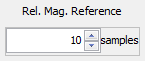 . If a
normalization region has been selected, that full region is used
instead of the first n values. In your example, you have the full
range of data selected in the normalization mode box, so the data
should be centered around zero since you also have "Out Mag"
selected. If "Out Mag" is also selected, the (potential
detrended/fitted/normalized/scaled/shifted) relative flux values are
then converted back to zero-based magnitude, which is what is
happening in your case. So just deselect "Input In Mag" and "Out
Mag" and disabled normalization to see your values display properly. . If a
normalization region has been selected, that full region is used
instead of the first n values. In your example, you have the full
range of data selected in the normalization mode box, so the data
should be centered around zero since you also have "Out Mag"
selected. If "Out Mag" is also selected, the (potential
detrended/fitted/normalized/scaled/shifted) relative flux values are
then converted back to zero-based magnitude, which is what is
happening in your case. So just deselect "Input In Mag" and "Out
Mag" and disabled normalization to see your values display properly.Extending Tool Tip Help Display: After a tooltip message is displayed, slowly move the mouse pointer back and forth over the item of interest to keep the message displayed longer. This is fairly easy using a physical mouse, but I imagine it may be more difficult using the trackpad of a laptop. As another tip, you can save plot setting using the Multi-plot Main "File" menu, send them to another computer, and then load the settings file on the other computer to recreate a plot, if there is ever a question of settings (or if you just want to recreate a plot at a later time). Karen |
|
|
Karen,
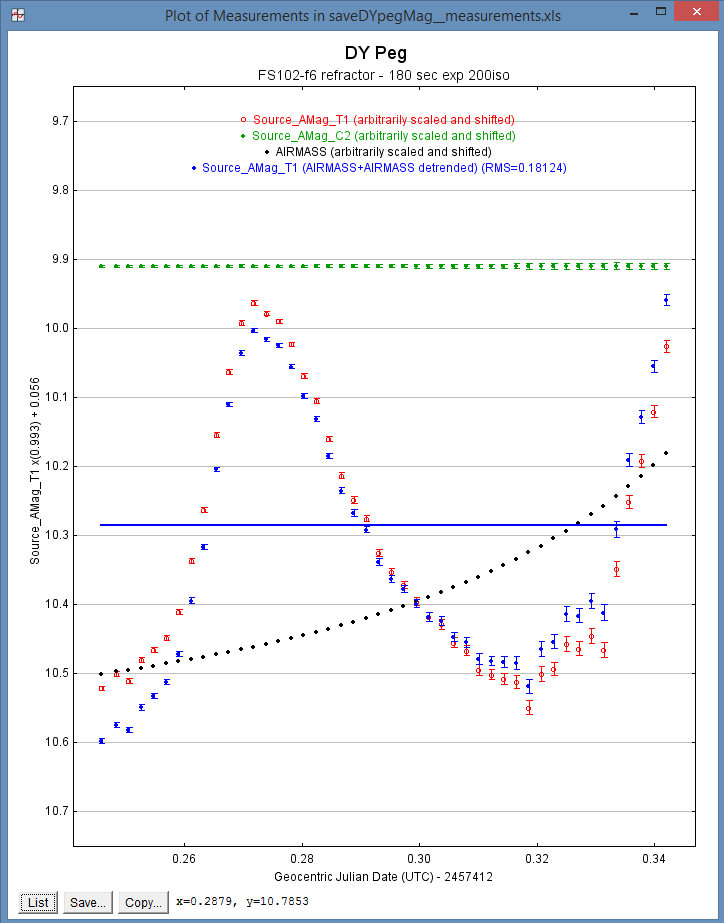
A few questions about magnitudes and plotting. The issue is : how can we get a direct plot in magnitude ? Magnitude measurements are easy to obtain in the measurement table, following your different posting on this subject, thanks for that. Now, I would like to get a plot automaticaly scaled and labelled with proper magnitude scale/legend on it. I suspect this could be made under AIJ plotting facilities, but didn't found the right way to do it. What I did to draw the following plot was to pick up the max and min magnitude value (source_AMag_T1) in the mesurement table , and then to adjust the scale and « then shift » in order the T1 light curve match the custom predefined Y scale in the multi-plot main. My variable varies between 9.97 and 10.56 in magnitude during observation/sequence (source_AMag_T1). The plot seems ok at first sight, but still, this is an arbitrarily scaled and shifted one. Plus, I would like to add an airmass detrended plot for comparison purpose, which I did. But I would like this detrended measurement also to be added as a new column and saved. Because my target was low above the horizon, this data are essential and must be considered as true brightness of my target. What is the proper name of the column in the table of measurement, if any ; I couldn't find one matching this requirement but I could have missed it, I confess. Maybe it is already there. I understand source_AMag_T1 is the observed real flux – sky, converted in mag, but it's not the « absolute » magnitude (as if observed from space) ; that's why I added an airmass detrended plot. Is my understanding correct ? Finally, I added a comp to the plot (also manualy shifted and scaled) just for showing the error bar growing as the star gets lower in altitude. Incidentaly, when the comp star is plotted at the same scale than that of T1, the error bar is just enormous, how can it be ? Ps : sorry about the images : iIdont'know how to add them to this message. I can send you privately, if needed. That's all for today;-) Thanks for any answer, Cheers, Christophe |
|
|
Here are the images relatvie to my previous message.
  Cheers, Christophe |
|
|
And, by the way, it appears that I've also found the need, in this case, to uncheck the option "Page Rel", which is a little bit counterintuitive to my sense. Anyway, that works properly !
Remains only the question on how to save this airmass detrented magnitude measurement  ChrisM |
|
Administrator
|
Hi Christophe,
I think you have figured out the "Page Rel" issue, but I'll give a little explanation here. The "Page Rel" option should only be used if you are plotting data such as airmass, tot_C_cnts, etc, if you only care about the shape of the curve, and not the exact data values. The "Page Rel" options forces the selected dataset to appear on the plot page without you having to figure out the scaling and shifting by hand. In this mode, the "Scale" value specifies the percent of the page to fit the plotted data on and the "Shift" value specifies the percent of the page to shift the plotted data. The "Shift" value will normally be between 50% (top of plot page) and - 50% (bottom of plot page). As you have figure out already, "Page Rel" should be disabled to plot typical data so that the plotted values correspond to the axis values (after making the scale and shift adjustments specified for that dataset). I you have a detrended light curve plotted, click the "New Col" icon (  ) on the left-hand side of the plot controls corresponding to the plotted data to save it to the table. you still need to save the
new table if you want to keep the table with the new columns added for future reference. Since AIJ updates plots in real time when changing settings, it is too slow to update the table every time a change is made, so you have to specify when to the save the
plotted data (e.g. after detrending, etc.) by clicking the icon and specifying the new column name(s). It would also pollute the table with a lot undesired new data columns if I attempted to add all versions of plotted data. ) on the left-hand side of the plot controls corresponding to the plotted data to save it to the table. you still need to save the
new table if you want to keep the table with the new columns added for future reference. Since AIJ updates plots in real time when changing settings, it is too slow to update the table every time a change is made, so you have to specify when to the save the
plotted data (e.g. after detrending, etc.) by clicking the icon and specifying the new column name(s). It would also pollute the table with a lot undesired new data columns if I attempted to add all versions of plotted data.If I have missed answering another question or if the above does not help, please let me know. Karen |
|
|
Karen,
Thank you for the last reply and explanations. All is clear know. I just have a few more questions today, and I have to submit what appears as a possible (small) issue with AIJ. When correctly plotting lightcurves in magnitude on the graph, there's no need to airmass detrending, as airmass is self-induced by the fading of the comp stars falling to the horizon … is that correct ? Indeed, as you can see on the following plot, the uncorrected/airmass detrended lightcurve, which I draw for experimentation purpose, for comet 209P, is exactly the same uncorrected/airmass detrented. What about the flux of the comps ? I mean : when doing a MA photometry, are the fluxes of all comps added and then the mean value of all comps used to set the value of the target, or is there a weithing of the different fluxes before adding their respective value, so that the comp stars that are brighter, are of much weight than the fainter one in the calculus. About a possible issue with AIJ when plotting with real mag/scale, please have a look to the following images. The comps C4 (mag 12.041) should be visible on the plot, but is absent for some reason. Also you can see there a small « ? » on the C4 row, in the « then shift » column. Finally, there's some light blue dots on the bottom of the plot, which – I think – corresponds to the C4 values which are relegated there, no matter any modification I performed in the Multi-plot Y-data table. The value of C4 appears to be ok in the measurements table. I can send you the data if needed, please let me know what you need. Have a nice day, Christophe 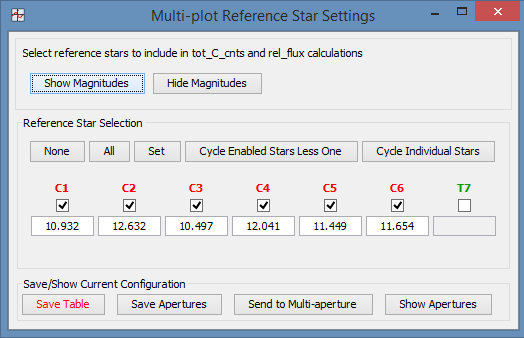 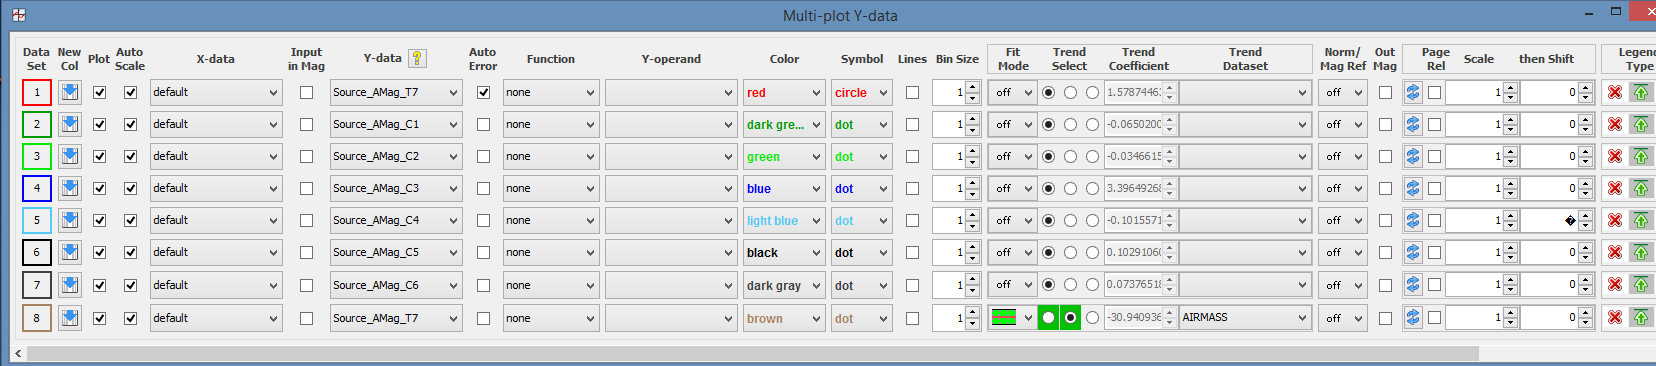 
|
|
Administrator
|
Hi Christophe,
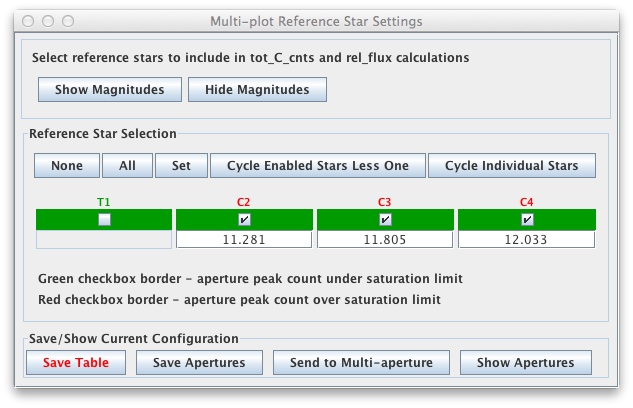
If the comps stars are not the exact same "color" as the target, you may see airmass trend. The amount of the trend will depend on the filter and the difference in the color of the objects. The trend could range from zero to several tens of mmag if the airmass change is extreme. However, at the scale you are plotting, you not be able to see the trend graphically. One thing I noticed is that detrended data generally have a line drawn through the average of the data, so I am wondering if something is going wrong with the fit since your plot does not show a line. Could you check and make sure all of the rows of the airmass data column in the measurements table have a valid number in them? The comp star magnitudes are effectively weighted by the brightness of the star. See equation C1 in the arXiv paper here: http://arxiv.org/abs/1601.02622 I'm not sure what is going on with the C4 plot and the odd character in the "then shift" column. I assume you are not able to enter zero in the "then shift" column? If you are not able to make progress based on the above comments, use the "File" menu of the Multi-plot Main panel to save the plot settings into a "plot config file" and then send me both the measurements table and the plot config file for me to look at. You can send those directly to karenacollins $&* at outlook ddoott com, without to gibberish characters used to try to foil email spammers. Karen |
|
|
Karen,
Sorry to bother you with all those trivial stuff ... >One thing I noticed is that detrended data generally have a line drawn through the average of the data, so I am wondering if something is going wrong with the fit since your plot does not show a line. Could you check and make sure all of the rows of the airmass data column in the measurements table have a valid number in them? The data are present and seems correct in the measurement table. Now, something I have found is an odd « comportement » of the « Norm Mag ref » button when switching from « Detrending » to « off » and from « off » to « detrending », the plots seems not to be able to take the new option into account, so the plot is not actualised despite the fact that the button is changed : the airmass value are not correctly plotted nor the line, or it did not disappearded when needed ... When acting a couple of time (twice clic, or triply clics) on the button, and finally the plot is actualised. (maybe a Windows compatibility trouble). Now, knowing that, it's easy to deal with : I clic on the button until the plot is airmass corrected. That's it ! >The comp star magnitudes are effectively weighted by the brightness of the star. See equation C1 in the arXiv paper here: http://arxiv.org/abs/1601.02622 Oh ! I see. Thank you for pointing this out. >I'm not sure what is going on with the C4 plot and the odd character in the "then shift" column. I assume you are not able to enter zero in the "then shift" column? Sometimes I enter zero, then the ? Car vanish definitely, sometimes it comes back when Enter is pushed. This guy is somewhat impredictible. Even if the ? Car disappears, and is remplaced by 0, the C4 stars is not plotted. I will perform new tests, and send you the data if I could not find any solution. Any way, I will keep you informed here. Thank you so much for helping, Christophe 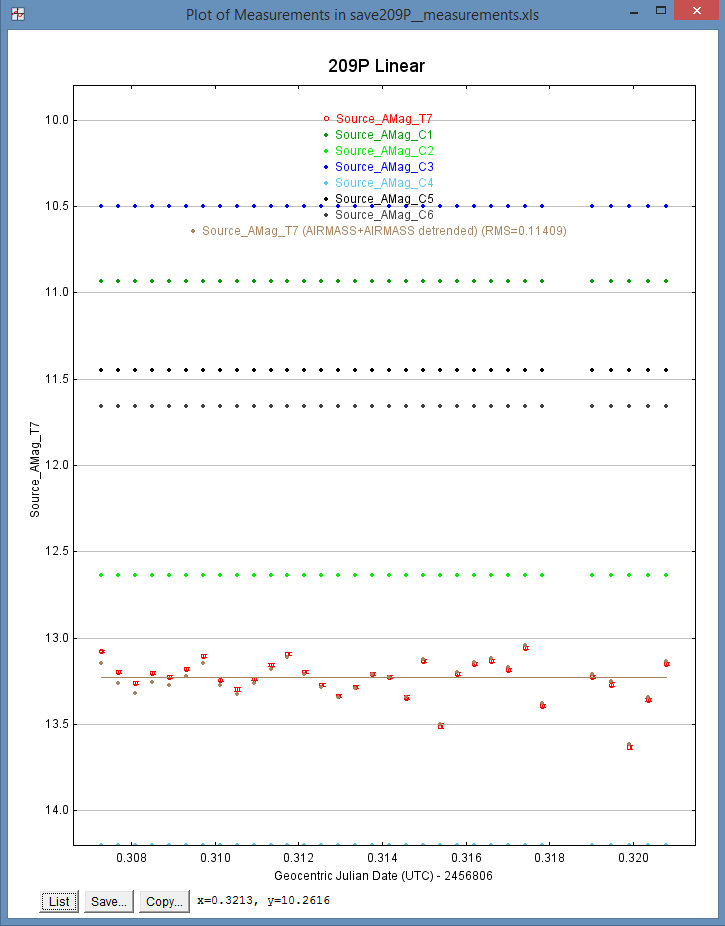
|
|
Administrator
|
Hi again Christophe,
The multiple clicks on the detrend button should not be required. I do most of my work and AIJ development on a windows machine, so I don't think it is an OS dependent issue. The odd character should not be showing either. If you could send me an example measurements table and associated plotcfg file, I could load the same environment you have set up to investigate what is going on. You can send the files directly to my email address mentioned previous if you want. Karen |
|
Administrator
|
In reply to this post by chrismlt
Hi Christophe,
Thanks for sending the files. I can duplicate your problem here. In researching the problem, somehow a NaN has gotten into the Shift setting. NaN is a designation allocated in the specification of number representations in computers called Not A Number. This is sometimes used in calculations to indicate an invalid result (something like dividing a number by zero). Once this number gets in the setting, it appears that the code cannot get out of that mode by entering a new number. It is not clear to me how that value got in the setting, but if you can figure out how to cause it, I can fix the bug. I will also keep my eye out in the code for a way for that to happen. I can probably find a way that a NaN does not get stuck though and have made a note to work around that in a future release. In the mean time, you can get out of this mode by enabling (ironically) "Page Rel", then press the button the the left of that checkbox that transfers the page rel settings to absolute scale and shift values (  ).
This will put a numbers into the scale and shift boxes, but now you can type in 1 for scale and 0 for shift and press <Enter> everything should be back to normal. ).
This will put a numbers into the scale and shift boxes, but now you can type in 1 for scale and 0 for shift and press <Enter> everything should be back to normal.I was not able to reproduce the problem of having to turn the "Fit Mode" on several times to get it to activate. If I go from Fit Mode "off" (  ) to Fit Mode "full light curve" ( ) to Fit Mode "full light curve" ( ),
it turns on every time. This got me to wondering if what you mean you have to click sometimes two times is the "Trend Select" modes ( ),
it turns on every time. This got me to wondering if what you mean you have to click sometimes two times is the "Trend Select" modes (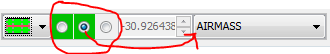 ). Sometimes these buttons do require two clicks
to change the green background to grey and vice verse. First, the blue dot in the center indicates which detrend variable name is showing in the selection to the right. Let's call that box with the blue center dot the active button. If the background is also
green, the detrend parameter is enabled and its name will show in the pulldown menu box. If the background is gray, that variable has not been previously selected, or it has since been disabled by clicking the selection when it had a blue center dot (i.e.
the button was "active") and its background was green and it had a variable name is showing in the pulldown menu. Here is a summary of the four possible states for each button: ). Sometimes these buttons do require two clicks
to change the green background to grey and vice verse. First, the blue dot in the center indicates which detrend variable name is showing in the selection to the right. Let's call that box with the blue center dot the active button. If the background is also
green, the detrend parameter is enabled and its name will show in the pulldown menu box. If the background is gray, that variable has not been previously selected, or it has since been disabled by clicking the selection when it had a blue center dot (i.e.
the button was "active") and its background was green and it had a variable name is showing in the pulldown menu. Here is a summary of the four possible states for each button:-a grey background in one of the "Trend Select" boxes means that variable option is disabled or has not previously been used -a green background in one of the "Trend Select" boxes means that variable option is enabled and a detrend variable has been assigned -a grey dot in the center of one of the "Trend Select" boxes means that variable is not selected for display in the pulldown menu (i.e. it is not the active button, but if the background is green, the parameter is still enabled) -a blue dot in the center of one of the "Trend Select" boxes means that variable is selected for display in the pulldown menu (if previously selected), or if not previously selected, the user is able to select a parameter corresponding to that box If a "Fit Mode" box does not have a blue dot in the center, the first click on the box makes it the active box and the blue dot appears. Now that box's detrend parameter is displayed (or can be selected if none has been selected previously). A click on a "Fit Mode" button that is already active (i.e. shows the blue dot in the center), will change the enable / disable state for that detrend parameter. ***So, the bottom line is that if a box is enabled (green) but not the active box (has a grey center button), it will take two clicks in the box to enable or disable that parameter.*** Regarding aperture sizes: all apertures in AIJ currently have the same aperture size in each image. The variable aperture mode only changes aperture sizes from one image to the next, but all apertures are still the same size within each image. This may or may not be something I add in the future. Using different aperture sizes for differential photometry will generally produce incorrect results. However, I do note that there are special circumstances where different aperture sizes within the same image may be useful. Karen |
|
|
Karen,
Many thanks for your consideration and help. Very useful reply, as usual ! About, the small «? » bug concerning C4 data in mag, I have done some tests, but, at least, I could not reproduce the sequence from which the odd car appears in the Multi-plot Ydata. The only detail I did notice is (before any other action in made in the table), when you click on the blue double arrow next to the page rel check box, this also put a « ? » car in the scale value. This is probably related to the previous issue. Well, I confirm you that the green « Norm Mag Ref » button in in cause about the very secondary bug in the Multi-plot Ydata table I told you previously. One needs, sometimes to click several time to cause an action with this button, or sometimes there is some delay when updating the plot. That is almost nothing, and not very important, I think. At least, this is not related to the Fit mode/trend/select/dataset buttons. Well, I also did notice something amazing in the measurements table when using the « Multiplot reference star stettings panel », when using a magnitude related plot. I've tried to switch between comp stars, so as to see the influence of a particular star on the target magnitude, in order to find any unappropriate/variable star in my comps – something regular I think – ; when doing this by clicking on the « cycle enable star less one » button, or by directly clicking on a « star box », so as to uncheck it, or by using the « cycle individual » button, then the magnitude of the star and that of the target are altered. The comp is definitely altered, no matter if you go back, and never return to it's pre-defined magnitude value. Ie : C2 is 13.54 mag on each line Source_AMag_C2 from image 1 to image 100. When cycling between stars, C2 become Source_Amag_T2, with 13.541245, 13.539845, 13.540548 and so on. When cycling further, it becomes Source_AMag_C2 once again, but the values stay as 13.541245, 13.539845, 13.540548. It never return to the original value of 13.54. So, if you toggle between all comps stars, the target magnitude could be considerably altered, until the target is compared only to the magnitude of the last remaining comp star. Then, nothing is ever changed, no matter what you do in the panel. I also noticed, that, even if a comp is considered as a target after cycling, the value of the « new » target is not changed if the comps are modified afterwards. Ie : when cycling, C2 becomes T2, with a mag changing from 13.54 to, say, 13.559847 etc. If you uncheck now C3, the all comps mag is changed, and T2 mag should be changed too, goind from 13.559847 to 13.560047 maybe. This is not happening, in fact, and C2 stays at 13.559847. Maybe I've missed something, but this is possibly a source of error. Anyway, if we know there's an error here, probably the best thing is not to use this process here. Sorry to bother you with details, the weather is catastrophic here, so I could not observe any star since weeks … So I stick to the computer for software testing;-) Have a nice week, Christophe |
|
Administrator
|
Hi Chris,
I haven't forgotten your post. I just need to find some time to do the testing on the comp/target cycling issue when magnitudes have been entered. Karen |
|
Administrator
|
In reply to this post by chrismlt
Hi Christophe,
Thanks for reporting this problem. I'm sorry it has taken a few weeks to look into this, but I can reproduce the problem with the AMAG values being lost in the measurements table. I have uploaded a fix to the "Daily build" version on the update server. Could you please update to the daily build and test on your end. Let me know if you can find any combinations that cause a loss of the original comp star magnitude setting when switching from comp to target to comp. Thanks for helping to make AIJ better! Karen |
|
|
Karen,
I've been performing some tests around this AMAG problem : it seems you've definitely fixed the bug. All seems working perfectly with a large number of comps. Cycling between Comps is a very interesting function. For instance, there is always some C star that do not want to show properly on the plot, remaining at the bottom of the plot whatever the Y range is ; but we knew this issue, and it is not a big one (this linked with the "?" special car in the Multi-plot Y data window). Cycling between stars did not improve the result, even if this comp is put as T. I've no idea from where the trouble comes from. Anyway, don't lose your time on this, other comps are showing pretty well, I think ;-) Thanks +++ Christophe |
«
Return to AstroImageJ
|
1 view|%1 views
| Free forum by Nabble | Edit this page |