Multi-plot graphing issue.

classic Classic list List threaded Threaded
9 messages Options
Reply | Threaded
Open this post in threaded view
|

Multi-plot graphing issue.

wvinton
Multi-plot is driving me a bit nuts. No matter what I set as the "default" x-Data, and then have the X-Axis label set as "Column Label" (in this case I have selected JD-HELIO but it doesn't seem to make a difference what default value I choose), the plot of measurements has on the x-axis "Julian Date - 0".  No matter how I try to affect the X-Axis Scaling ("Auto X-range", "First X-value as min") the values that appear for X-max and X-min are 1 and 0, which matches the graph.  Similarly, the Y-axis scaling seems to be stuck on 1 and 0 (though the axis label reads rel_flux_T1... as I requested.)  As a result, no data points are being plotted.  The data table seems to be filling normally.

This was working fine until about a week ago - now it seems stuck.  I deleted the old (vs 4 ) version of AIJ and reinstalled the new vs 5 version (thank you!), but still the same result.  

I'm running a 14 inch MacBook Pro, Apple M1 Max chip, macOS 12.4.

Thanks!
Reply | Threaded
Open this post in threaded view
|

Re: Multi-plot graphing issue.

karenacollins
Administrator
Do you see a plot if you use JD_UTC for the x-axis? If so, check the values of JD-HELIO in the measurements table and make sure they look as expected.

Karen
Reply | Threaded
Open this post in threaded view
|

Re: Multi-plot graphing issue.

wvinton
As far as I can tell, everything in data table looks as expected.  The problem exists with JD-UTC, JD-240000, BJD-TDC - everything I've tried!
Reply | Threaded
Open this post in threaded view
|

Re: Multi-plot graphing issue.

karenacollins
Administrator
Please send up a measurements table and plotcfg pair of files that will show the problem. Either link the files here or send to karenacollins atatat outlook dotdot com.

Karen
Reply | Threaded
Open this post in threaded view
|

Re: Multi-plot graphing issue.

wvinton
Here are several screen shots plus the measurements table and plotfcfg files. Notice that the x-axis seems to be showing correctly now (?!?) but that the label seems to be stuck on "BJD-TDB - 2147483647". The y-data seem to be stuck though, with a min-max of 0 to 1, no matter what I do. Hope you can make sense of this! Measurements.plotcfg Measurements.xls Thanks for everything - especially your promptness! Bill
Reply | Threaded
Open this post in threaded view
|

Re: Multi-plot graphing issue.

karenacollins
Administrator
I can see the problem with your measurements table and plotcfg files. Something has apparently gotten corrupted in the plotcfg file. I can't track down the problem at this time, but we will try to determine what is going wrong to avoid the problem for others.

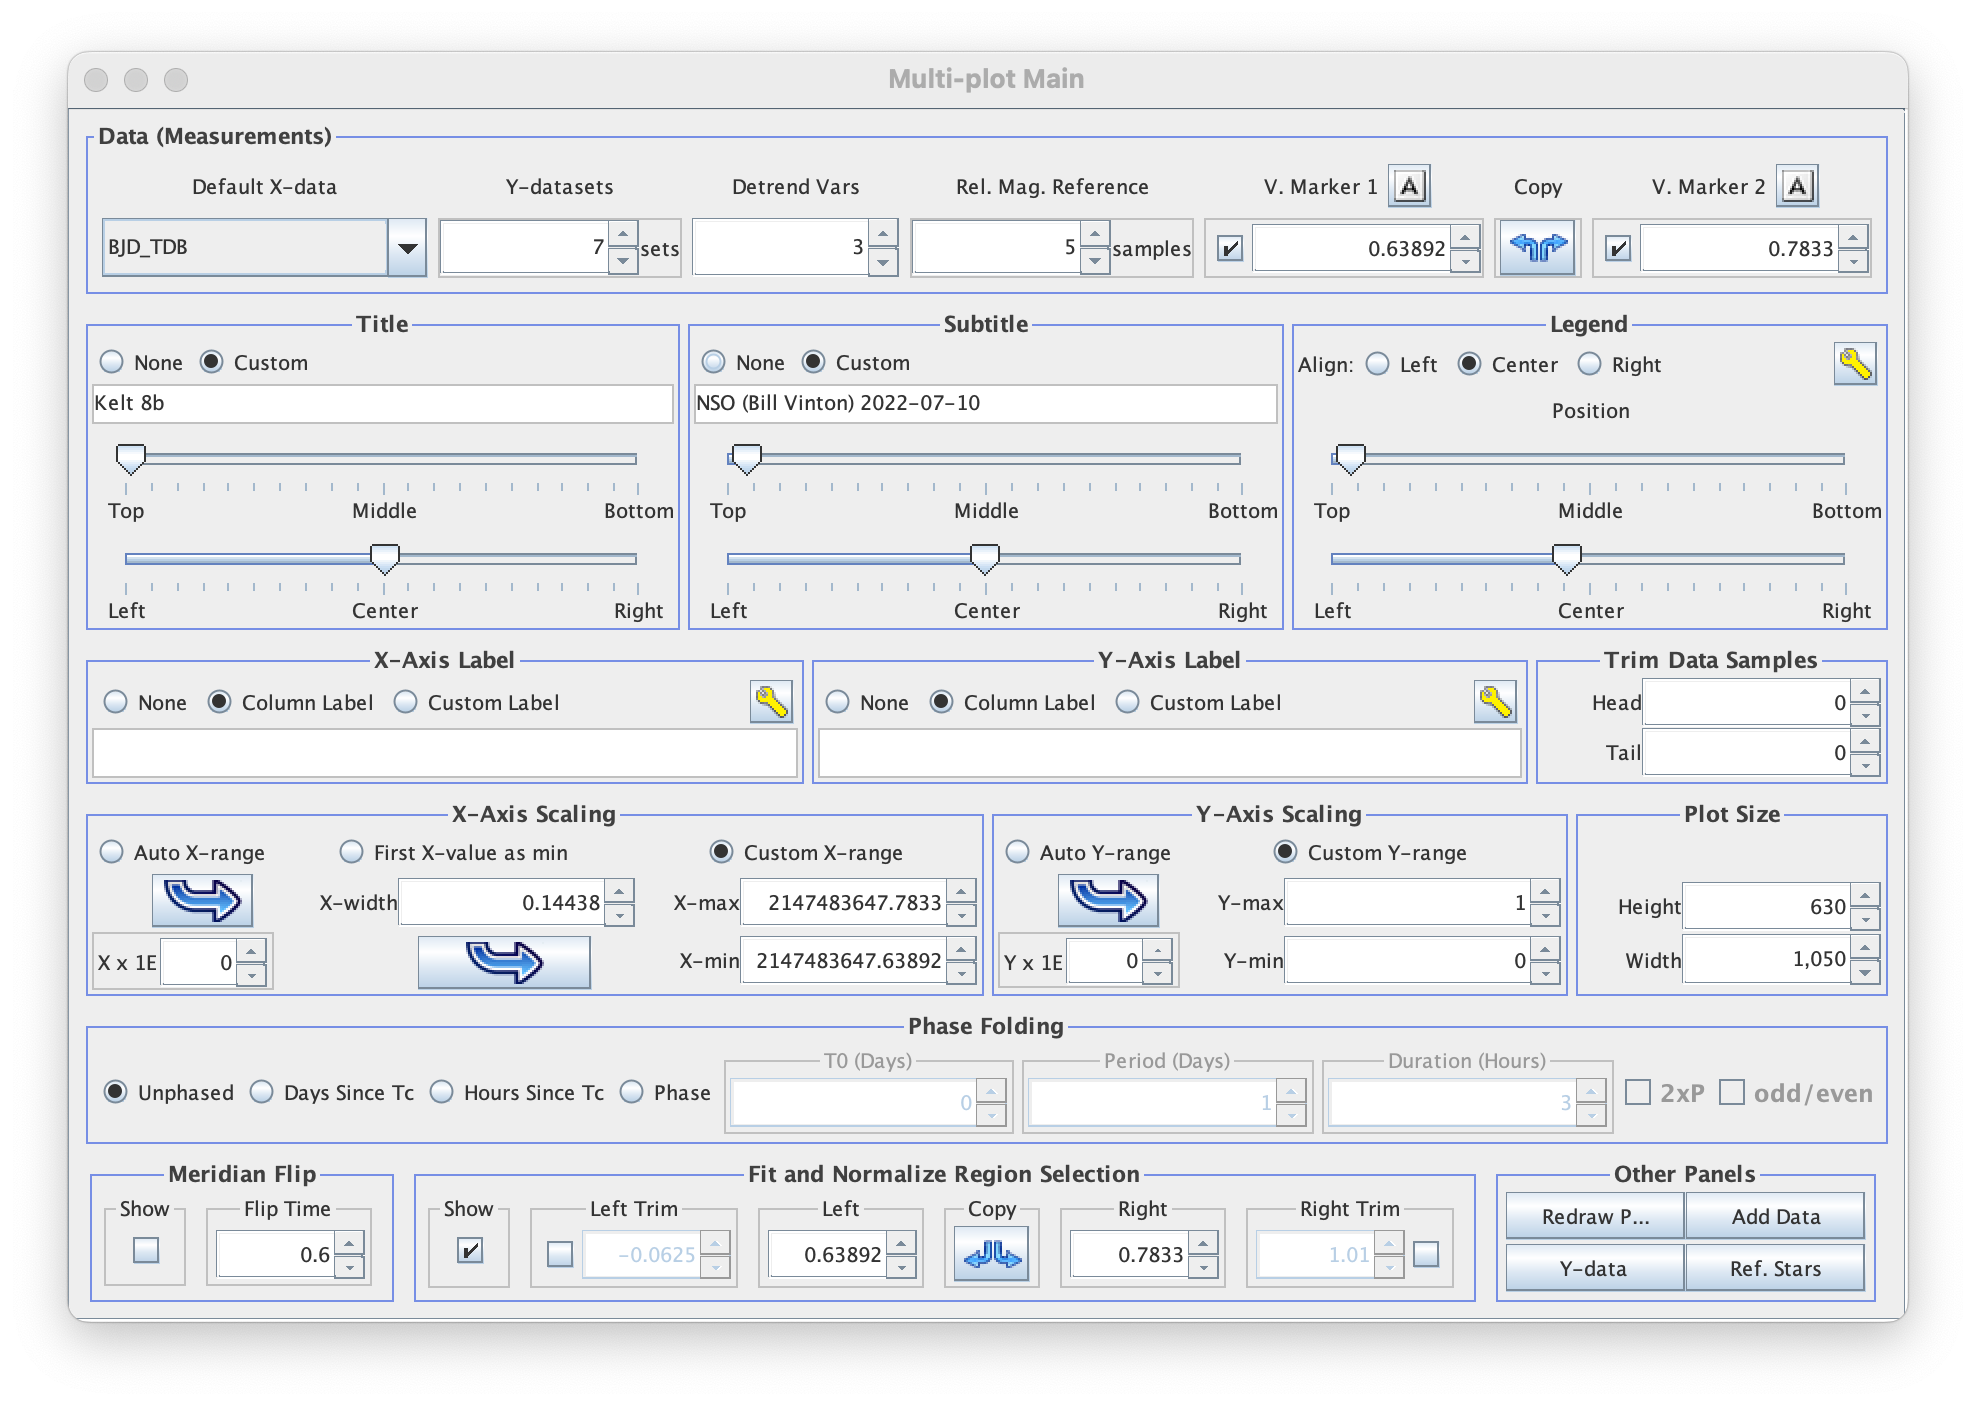
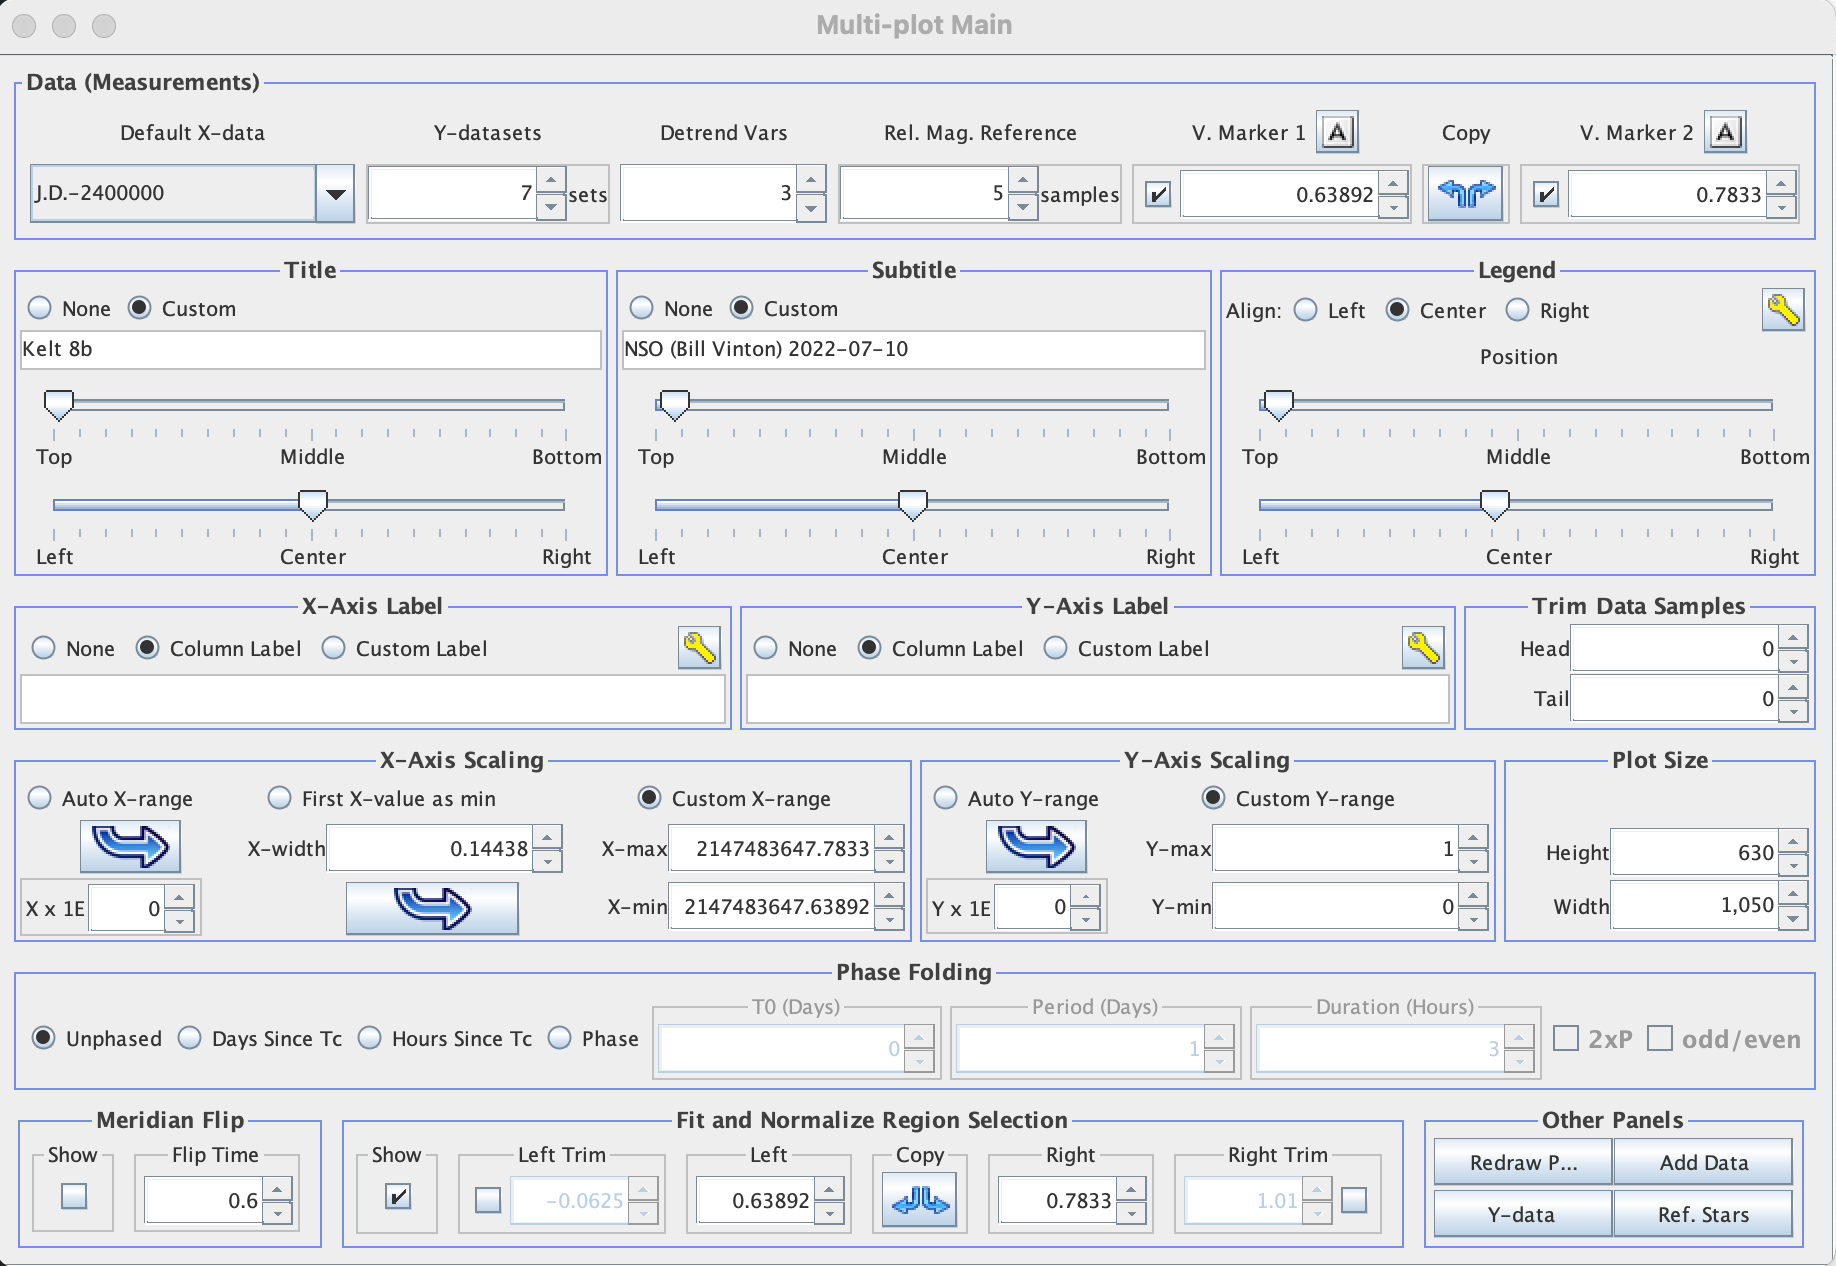
In the meantime, you'll need to reset your AIJ preferences to the defaults. I have verified that your measurements table will then plot correctly. To do so, go to Multi-plot_Main > File > "Restore all default AIJ preferences. Then restart AIJ and set up your plot as desired.

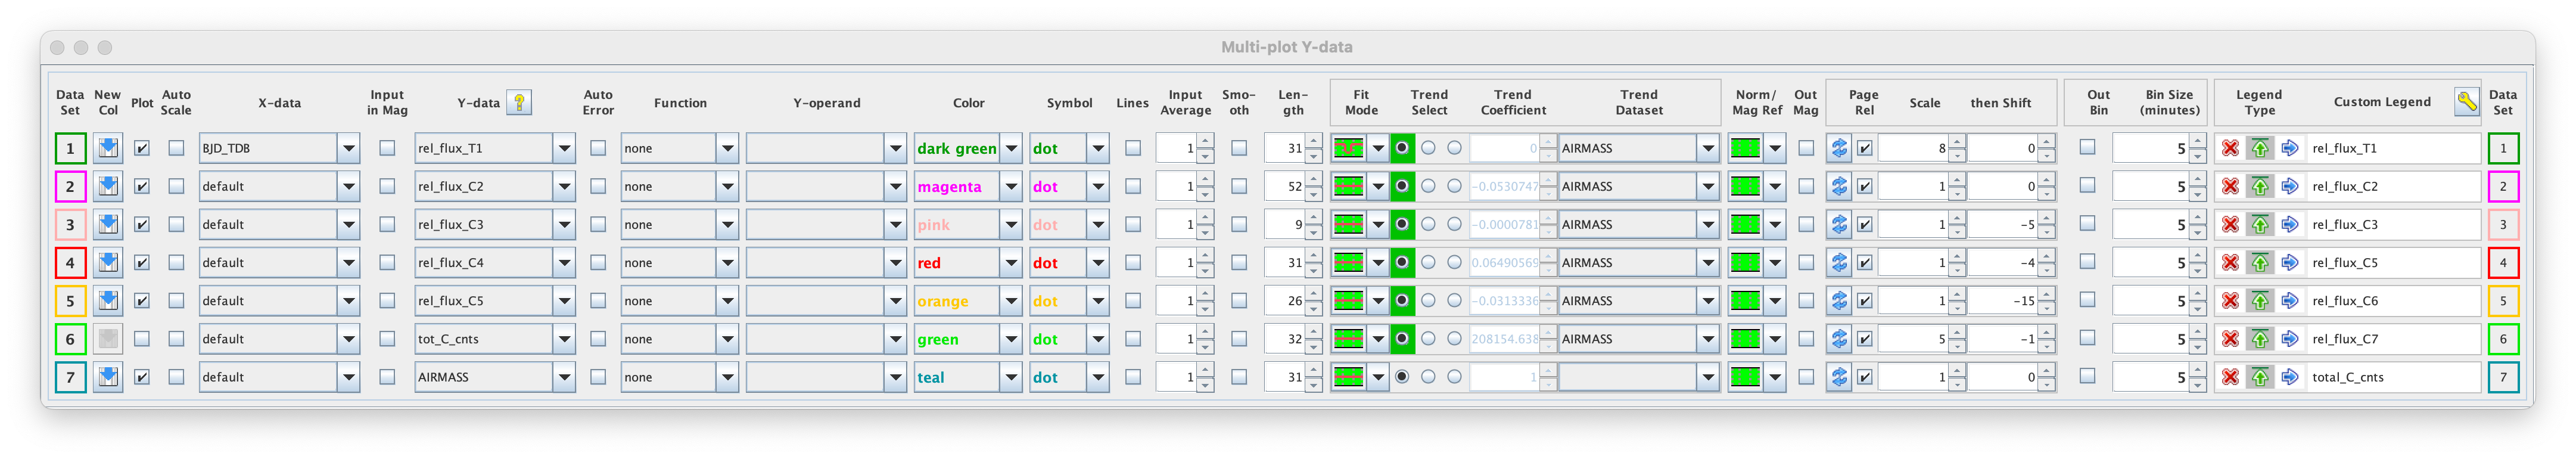
I will not a couple of things about your measurements table. All of your airmass values are "-1". This probably means you didn't have ra and dec and lat and long set correctly when airmass was calculated.

You are also using the above incorrect airmass to detrend, which causes a problem. I don't know yet if this is how the measurements file got corrupted, but it could be related.

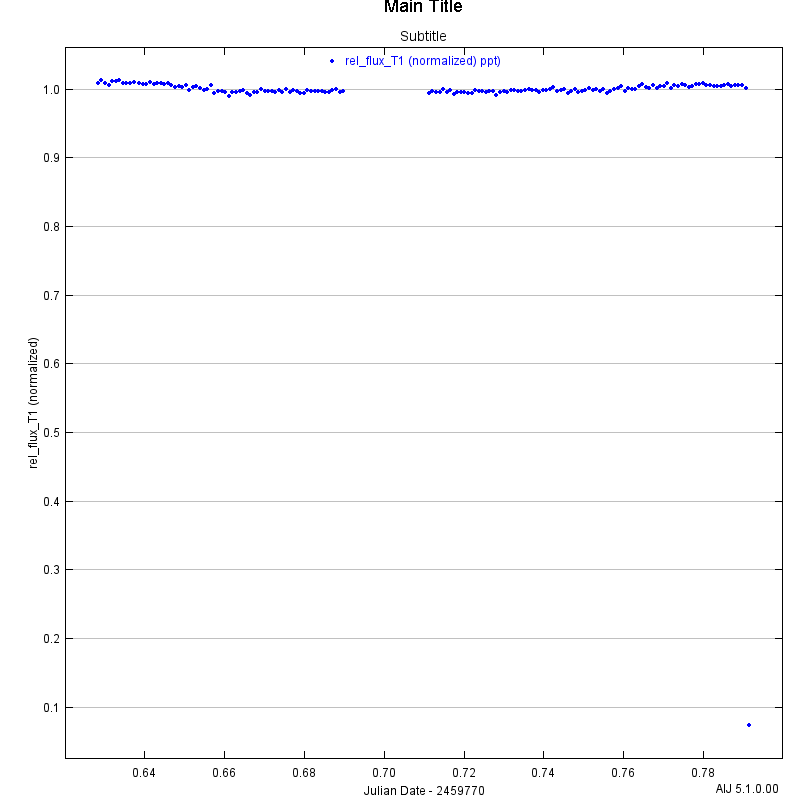
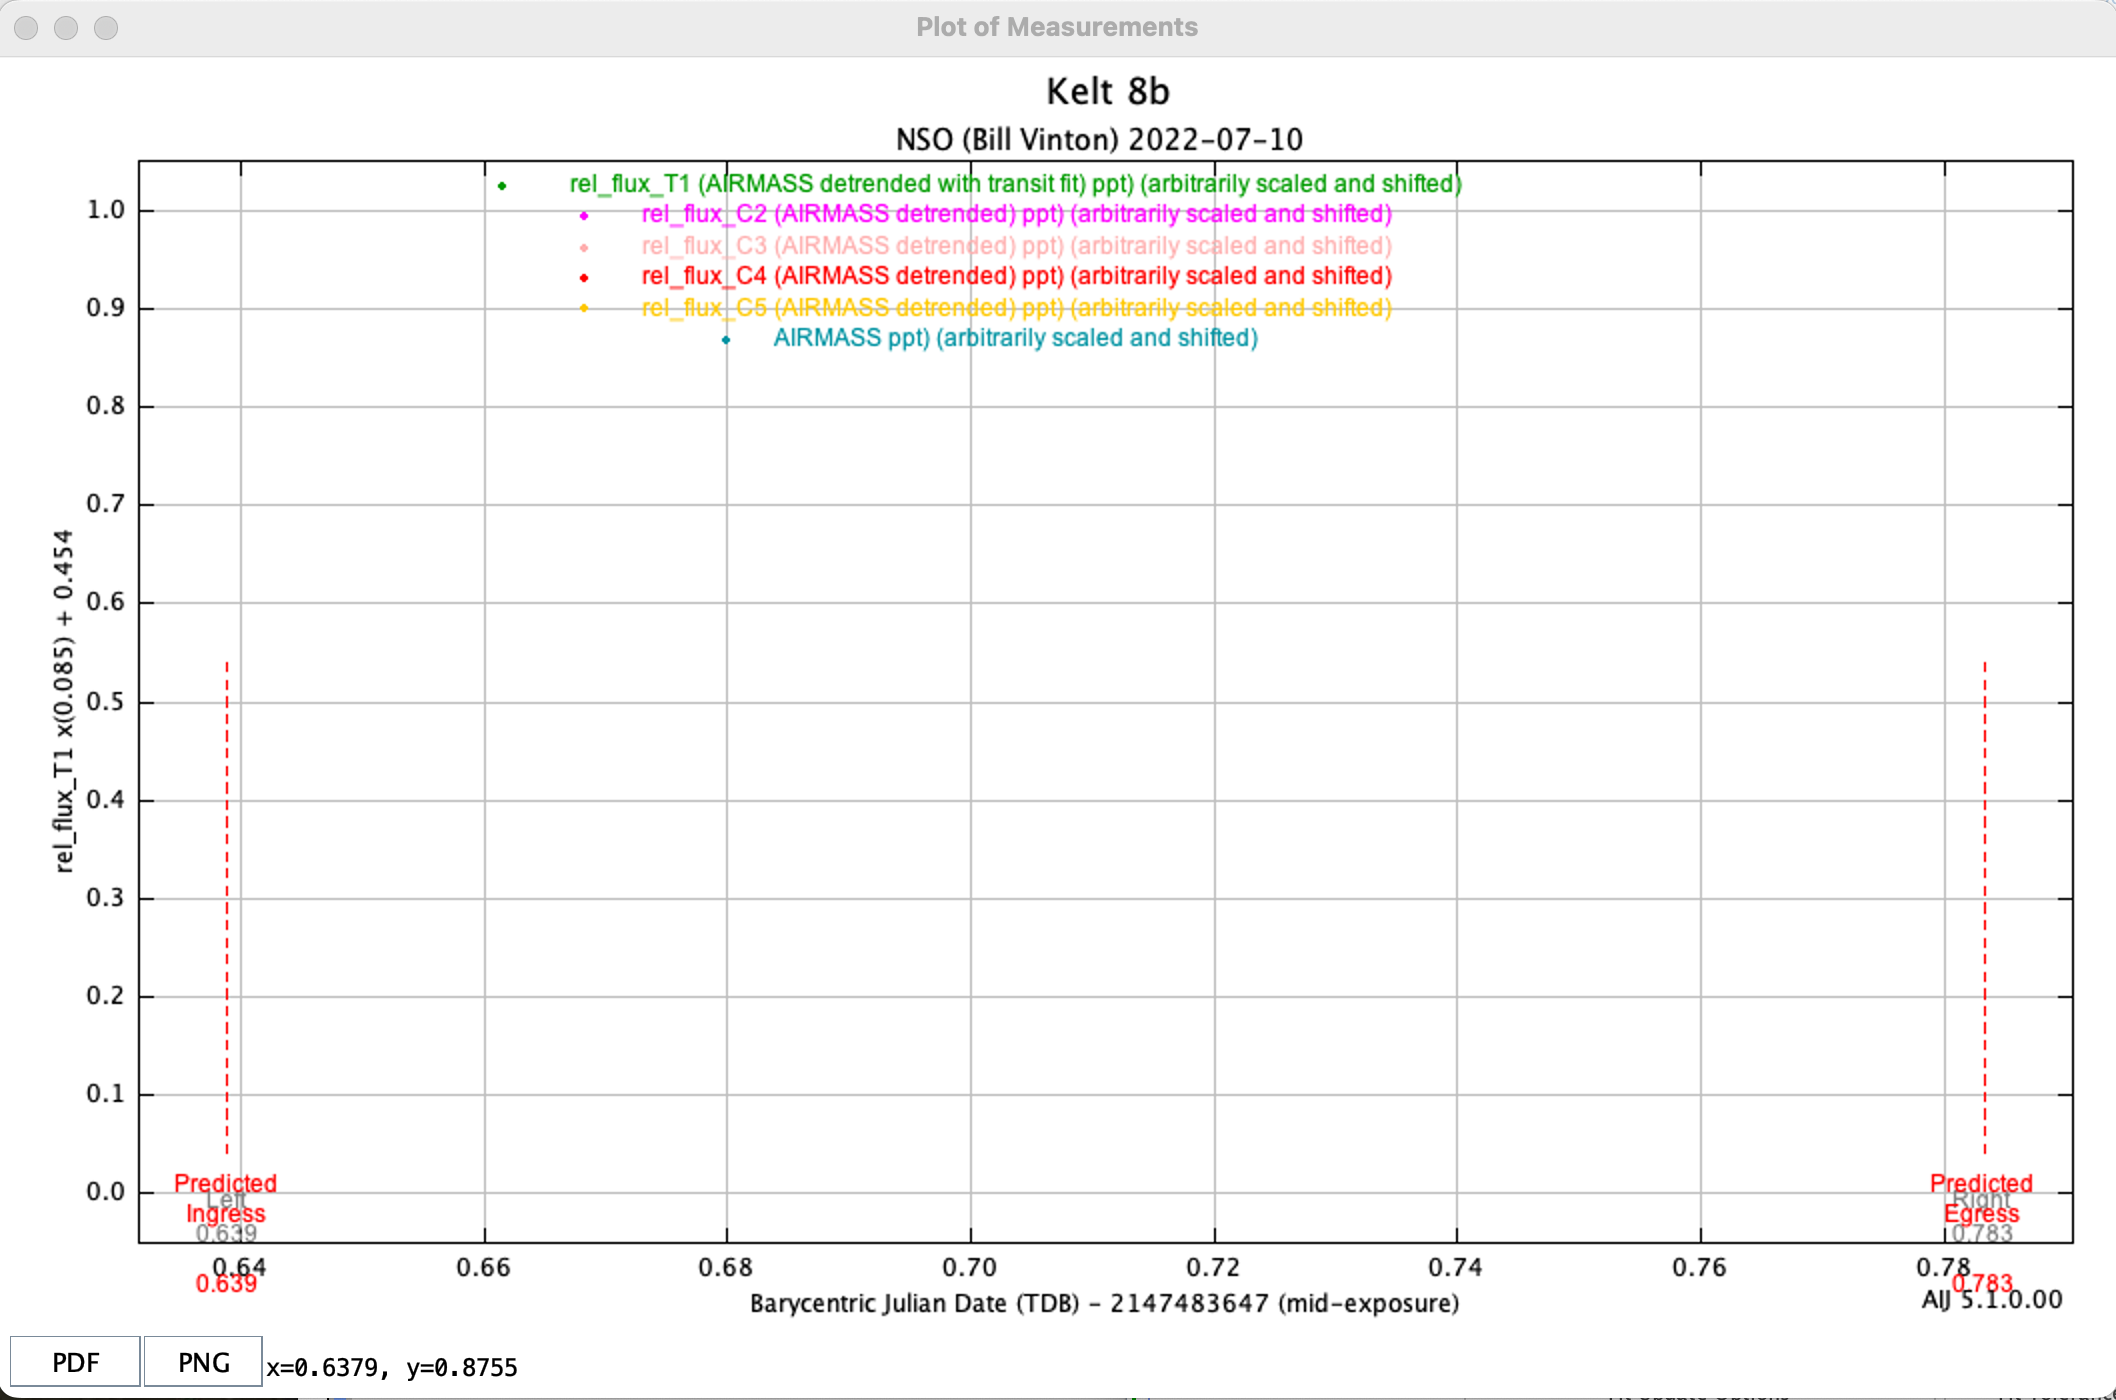
You will notice that there is one very low point at the end of your observation. This could be causing plot problems for you when you get things set back up. You'll probably want to remove that bad data point.


Reply | Threaded
Open this post in threaded view
|

Re: Multi-plot graphing issue.

wvinton
Hmm.  I see the Airmass issue.  The odd thing is that in the original files, Airmass was just fine in the FITS header.  For some reason, when I "updated" (to determine the BJD-TDB), the values all went to -1.0 in the FITS headers of the updated files....  Not sure why!

I'll follow your suggestion to reset - I had noticed the odd point, but that didn't seem to affect my main problem when I deleted that slice, so I kept it in...

Again, thanks so much!
Reply | Threaded
Open this post in threaded view
|

Re: Multi-plot graphing issue.

karenacollins
Administrator
If you used "Add astronomical data to table" to add BJD_TDB and also had "Airmass" enabled in the panel, but didn't enter your RA, Dec, lat, and long into the "MP Coordinate Converter" panel, then the airmass values in the table will be overwritten with incorrect values. BJD_TDB would also be wrong unless you entered the correct RA and Dec. You could re-run "Add Data" with the correct lat,  long, RA, and Dec to fix the that problem in the table.
Reply | Threaded
Open this post in threaded view
|

Re: Multi-plot graphing issue.

karenacollins
Administrator
We tracked down this problem. I hadn't noticed on the Y-data panel that no "Auto Scale" checkbox is selected. I recommend selecting them for all curves plotted when intending to use "Auto X-scale" on Multi-plot main. Then also check "Auto X-scale" on the Multi-plot Main panel.

We are improving the current implementation to use the "Default X-data" column for X-axis autoscaling if "Auto X-scale" is selected on MP Main, but no "Auto Scale" check boxes are selected on the Y-data panel.

Karen