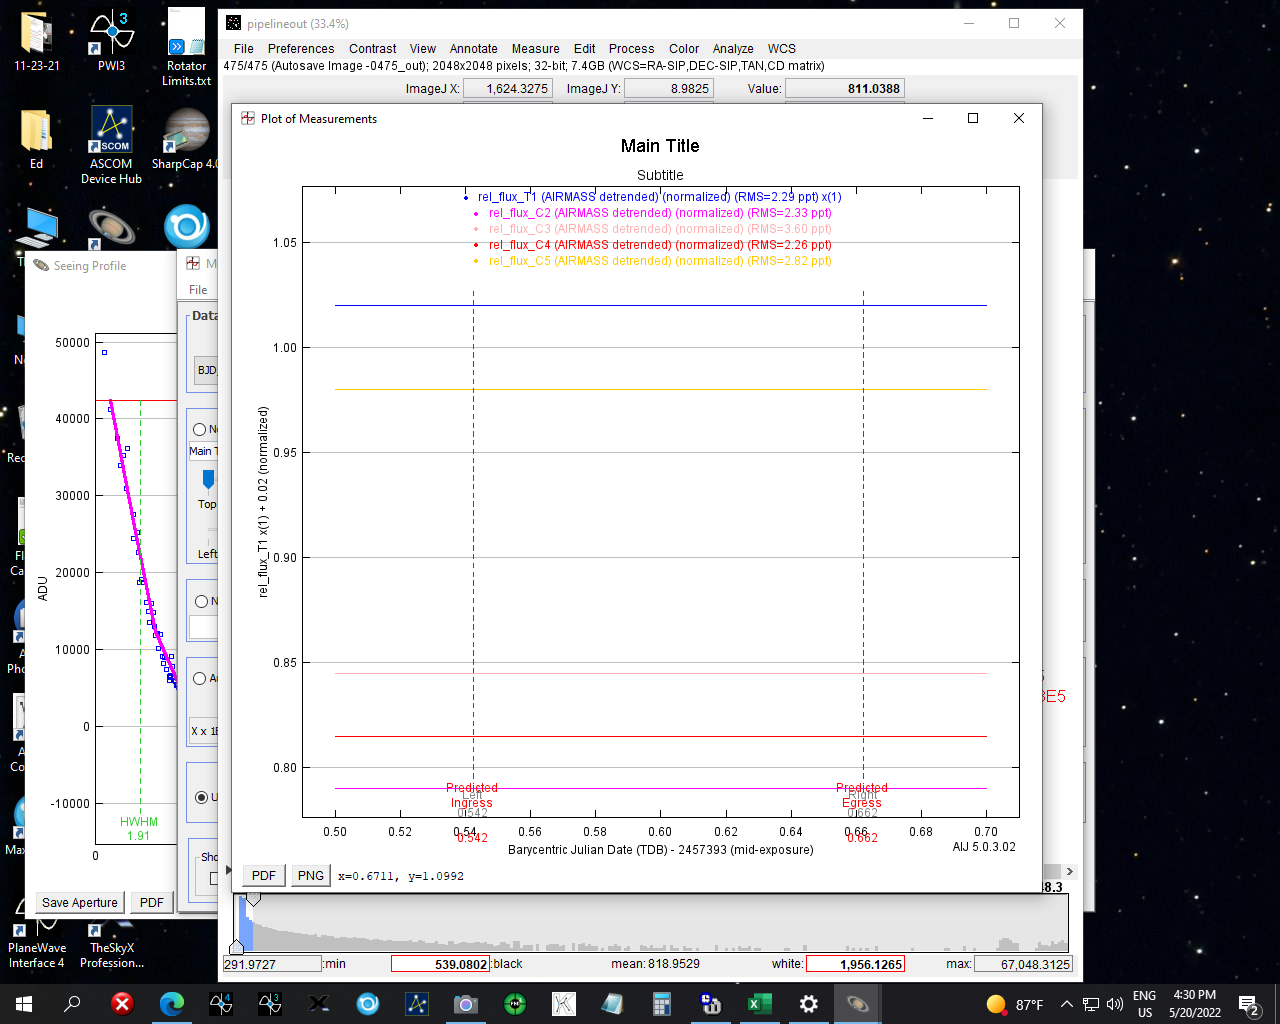
Lines but not dots showing up on Plot of Measurements screen

Lines but not dots showing up on Plot of Measurements screen

|
Re: Lines but not dots showing up on Plot of Measurements screen
|
|
Re: Lines but not dots showing up on Plot of Measurements screen
|
|
| Free forum by Nabble | Edit this page |