How to save a live surface plot profile?
|
Can any one tell us how to save the Live surface plot profile in animated form?
Thank Regards Thomas |
Re: How to save a live surface plot profile?
|
Administrator
|
Hi Thomas,
I'm not sure if there is a way to do this, unless you use a 3rd party video screen grab tool. However, the live surface plot feature is inherited from the underlying ImageJ platform and an ImageJ plugin, so it might be worth posting the same question on the ImageJ forum here: http://imagej.1557.x6.nabble.com/ Karen |
|
Karen
First thanks for the reply. Here is what we are trying to get at . We are trying to come up with a straight forward simple way to estimate satellite flash rates to get the tumble rates from a video. What we have been trying to do is come up was a process that any amateur can used to get these rates. The issues does not seem to be limited to just the amateur satellite community for such use. Let us give the example on Astro H which we have been working on. The people at satobs gave estimation of tumble rates at a little over 11 seconds most are visual estimatations. Observation of the main A debris by the Subaru telescope got a tumble rate of a little over 5 seconds Then the Engineering Physics students at Embry-Riddle Aeronautical University 2.6 seconds http://news.erau.edu/top-news/embry-riddle-students-track-and-observe-damaged-hitomi-x-ray-satellite-and-its-debris-with-optical-telescope#sthash.ndkiSkkM.VMMj1tga.dpuf Karen if all these rates are to believed then Astro H, A debris has taken on an insane (violent) tumble rate, our as we like to call it the tumble of death. The problem is we believe signs of the tumble of death were there on the 4-2-2016 from video of a pass we imaged. Video of this pass can be viewed and download here. https://vimeo.com/163812902 So Karen and others if you can help us come up with a way to figure tumble rates from video would be great. Two things to make this even harder is taking in synotic and atmospheric scintillation effects and at least averaging out these effects. Seems averaging the frame works for the synotic effect but seems if one wanted to really get at the heart of brightness variations caused by atmospheric scintillation then seems one would have to go beyond averaging and do a deconvolution process on the frames of the video but averaging should get one in the ball park for a simple process. There are some who do argue that atmospheric scintillation is not a real issue here but these people are using still images to figure such rates and video is turning out to be a horse of a different color which we believe is caused by sample rates or in this case frame rates. Seems in these two areas there is no total agreement. Any way here is the issues were are trying to deal with with Astro Image J and Image J. For both programs it is a very steep learning curve for the non-professionals. Karen have tried to get help on IMage J forum but no luck. Thanks for any help Regards Thomas |
Re: How to save a live surface plot profile?
|
Administrator
|
Hi Thomas,
I have no expertise in this area, but I watched the video and I see a ~2 sec period in the main brightness variation. If that is caused by tumbling (I don't have the experience with satellite imaging to know), then why can you just run straight forward aperture photometry on the time series and measure the period precisely? Karen |
|
Do not wish to be a bother but can you point us to a reference document that will tell us how to go about what you suggested. We can spend several days trying to wade through AstroImage J documents to figure this out. We are not professionals or do not have a let of computer programming skills so any help would be appreciated. Also in the middle of a build on a knew imaging system so a little stressed and and stretched right now trying to work through the technical issues. If we can figure this out would like to show this to others in the amateur astronomy and satellite observing community because believe it could lead to a better way to estimate tumble rates off of video. Right now the majority are still using just stop watches to make these kind of estimations. Karen your estimation is close to what we get and seems to agree with the Riddle student. The issue is also sub picks which are important to since we are dealing with a satellite tumbling on multi-axis Thanks once again for the help and it is greatly appreciated. Regards Thomas On Friday, April 22, 2016 10:45 AM, karenacollins [via AstroImageJ] <[hidden email]> wrote:
Hi Thomas,
I have no expertise in this area, but I watched the video and I see a ~2 sec period in the main brightness variation. If that is caused by tumbling (I don't have the experience with satellite imaging to know), then why can you just run straight forward aperture photometry on the time series and measure the period precisely? Karen If you reply to this email, your message will be added to the discussion below:
http://astroimagej.1065399.n5.nabble.com/How-to-save-a-live-surface-plot-profile-tp382p385.html
|
Re: How to save a live surface plot profile?
|
Administrator
|
Section 10 in the user guide will walk you through how to do time series
photometry: http://www.astro.louisville.edu/software/astroimagej/guide/AstroImageJ_User_Guide.pdf In my estimation, more amateur astronomers use AIJ than professionals. Here is a user guide that was written by an amateur astronomer for amatuer astronomers and explains how to perform transiting exoplanet observations. That should also be adaptable to what you need to do: http://www.astrodennis.com/ The only difference in the above examples and yours is that you need only one aperture instead of many, and you need to plot the Source-Sky_T1 data column rather than rel_flux_T1 data column. AstroImageJ is a Graphical User Interface based program, so no programming skills are required. Karen |
|
Karen Thank you very much for your help and kindness. We will give it a shot this weekend since the forecast is for rain. Karen none of the amateur astronomers we know have ever heard of AstroImageJ. Have a friend who wants to do a talk on Astroimage J at the local Astronomy club so this is one example he can show for it's use. Thank you Regards Thomas On Friday, April 22, 2016 1:28 PM, karenacollins [via AstroImageJ] <[hidden email]> wrote:
Section 10 in the user guide will walk you through how to do time series
photometry: http://www.astro.louisville.edu/software/astroimagej/guide/AstroImageJ_User_Guide.pdf In my estimation, more amateur astronomers use AIJ than professionals. Here is a user guide that was written by an amateur astronomer for amatuer astronomers and explains how to perform transiting exoplanet observations. That should also be adaptable to what you need to do: http://www.astrodennis.com/ The only difference in the above examples and yours is that you need only one aperture instead of many, and you need to plot the Source-Sky_T1 data column rather than rel_flux_T1 data column. AstroImageJ is a Graphical User Interface based program, so no programming skills are required. Karen If you reply to this email, your message will be added to the discussion below:
http://astroimagej.1065399.n5.nabble.com/How-to-save-a-live-surface-plot-profile-tp382p387.html
|
|
Thomas,
I've downloaded the original file and will extract the photometry. Then probably using aperiodogram soft such as Period04, the exact period will be easy to grab. I think the atmospheric effect is not an issue here as this is almost pure random noise ; it will probably not affect so much the main period. I'll post any result here. C |
|
C
Thank you.We have no idea what Period 4 is. So we need to learn another program on top of AstroImage J. Well at least we have some programs to play with when monsoon season gets here to pass the time. Gee thanks guys for hurting our little head and killing off the last few brain cells we have left. Ow that hurt! ;O) Best Regards Thomas |
|
This post was updated on .
Thomas,
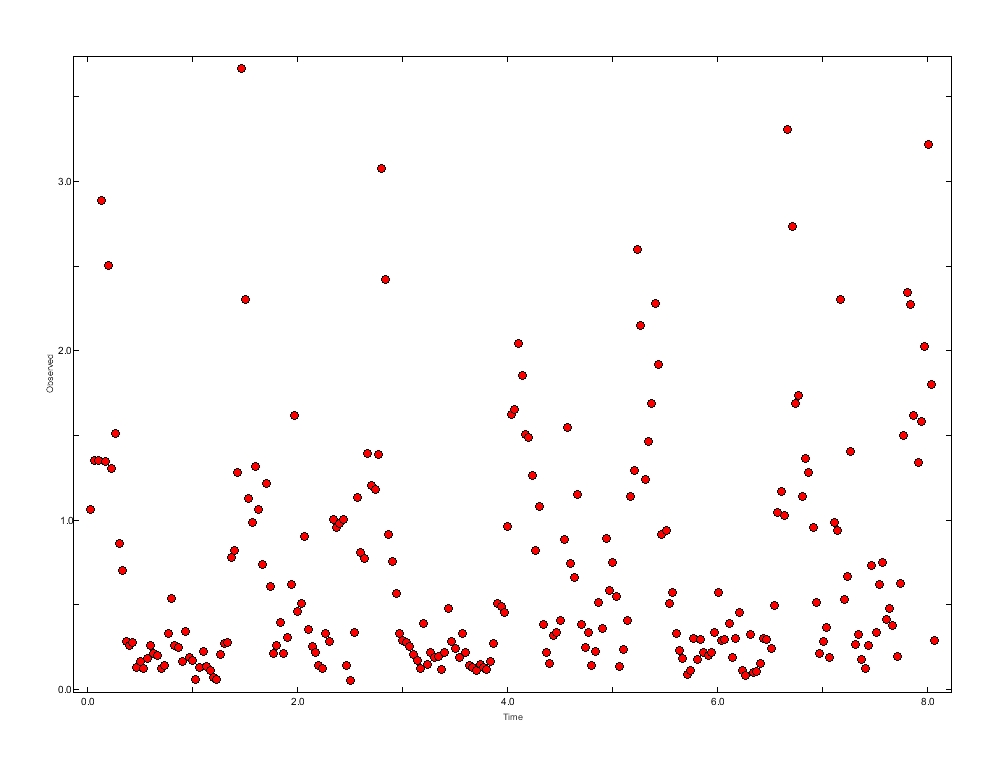
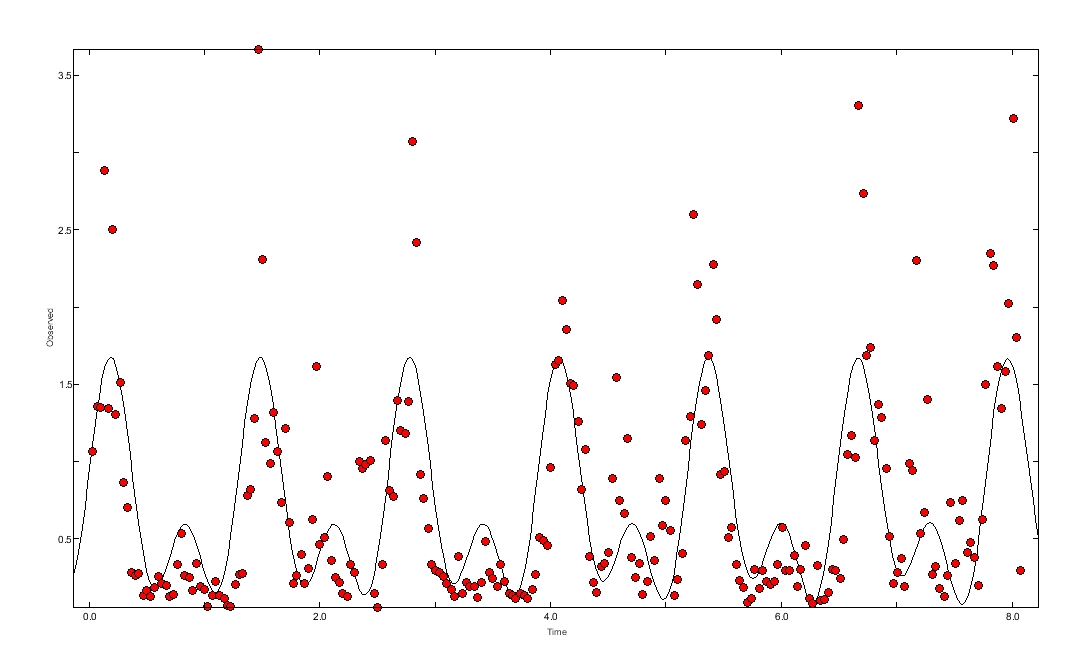
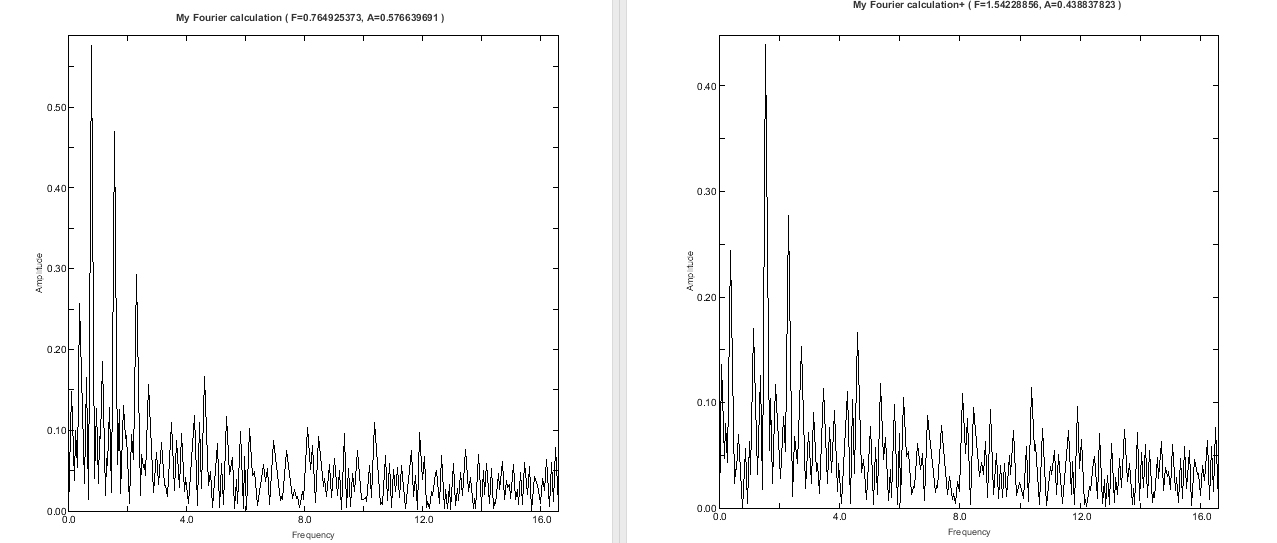
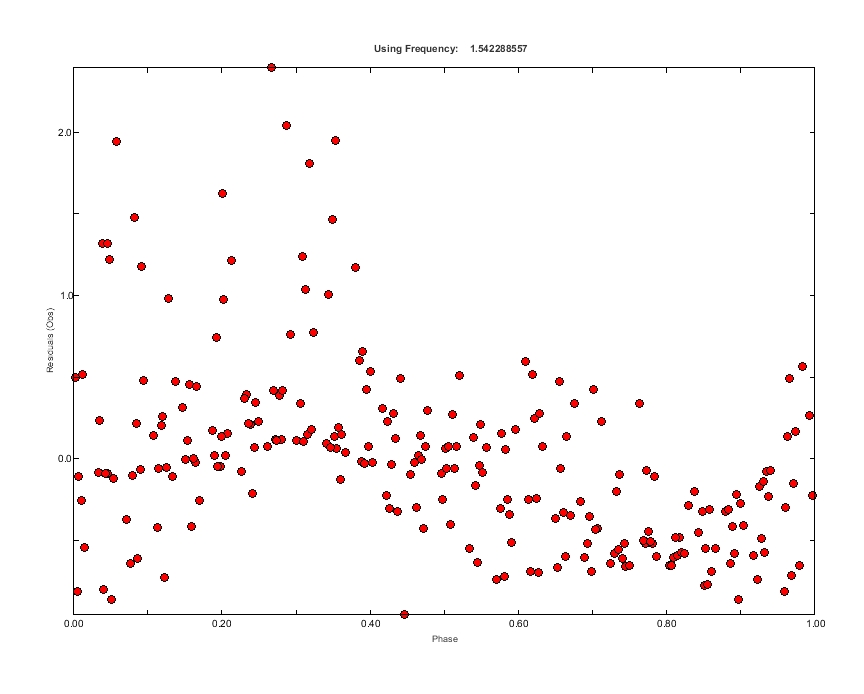
Here are the results I get using AIJ to extract photometric data, and then Period04 to extract a possible period in the data - if any. As the found period are not matching the results you posted here previously, this is to be taken with some caution. Nevertheless, this may be convincing at first sight. To extract photometry, I compared the satellite brightness to the bright star visible in the lower left corner of the image.  The brightness is in relative flux to the star flux, which is 1, by convention. Please note that : the satellite brightness sometimes droped to a level very near 0, so the bottom of the light curve is somewhat noisy. And : some of the brightest images of the satellite are partially saturated, so the satellite brightness could be sometimes more elevated that it appears here. Also, the last 20 images of the avi were not usable because the satellite was near the edge ; there remains only 242 images to be measured. At first sight, a period near 1 second seems visible from the raw curve. Using Period04, two periods seems to emerge at a level of confidence : (Below F1 and F2 are frequencies ; first col = freq , sec col = amplitude , third col = phase ; residual are in amplitude = most of the scintillation noise, presumably at first sight) F1 0.769059429465814 0.541805937197838 0.104171144385021 F2 1.54564613145243 0.442123765492428 0.96015439054003 Residuals = 0.481029316 Here are the graph showing the two imbricated periods :  Period04 is not always as good as needed to derive amplitudes, so be cautious with this. Now : here are the Fourier graphs showing the used peaks in the analyze , and the phase plot. As you can see, the plot is not totally convincing, as the residuals are somewhat dispersed. Going further is this analyze seems not to be feasible as there is not enough data, I think. Well, maybe not ;-)   About the scintillation : as anyone can see from your video, the main period (the one that brings the satellite from dark to brightness) is evidently not due to the atmopheric scintillation. To evaluate the real impact of the atmospheric scintillation we need to know more detail about the video : specially what was the altitude of the satellite when the images were taken. What was the estimated magnitude of the satellite, and what was the used gear (telescope/camera). Now, really, I do not think scintillation is a real issue here, as the scintillation is probably no more than a few percent of the variation (this can be derived from the comparison star, if needed). More : some noise seems to be due to the file format (compression). Two more thinking : As there was only 8 seconds of data to analyze, the result is very partial. It could be greatly improved by adding more images, if you have some. The period as shown here is probably only a part of the reality : should the satellite be impacted by something, the satellite is possibly spinning around 3 axes, with more than 2 periods ... Now, the freq 2 is almost double as freq 1, so it may be that there is only one rotation period, with two flashes during one rotation. Well, I hope this will help ; and you get the result before the monsoon ;-) If needed, I can send you the original extracted data ; in this case : please let me know your email adress here and I will contact you privately. If you have news, I may be pleased to reader further on this case, so post here, please! Christophe |
|
Christophe
Thanks! The two periods shown in your plots is closed to the periods we got measuring the max peak to peak on our 3D surface plot. Could you please send this to us by e-mail. drygulch_99@yahoo.com The issue is how to understand a satellite or rocket body in a multi-axis tumble and to get a tumble rate. Seems it is not as straight forward as some claim in the satellite observing community and visually timing flash rates even over a long track we are coming to believe are poor at best since most never cover a little over a minute and sub flash peaks can easily be missed. For us we were just trying to come up with a way to basically tell if a satellite is tumbling or not especially if they are in rapid tumble. Thanks for the help Regards Thomas |
«
Return to AstroImageJ
|
1 view|%1 views
| Free forum by Nabble | Edit this page |

