Four Light Curves for Same Exoplanet

classic Classic list List threaded Threaded
4 messages Options
Reply | Threaded
Open this post in threaded view
|

Four Light Curves for Same Exoplanet

nkaraman
Hello,

I have four transit observations for same exoplanet. I want to plot these four light curves at same plot window by shifting on y-axis. How can I do this with AstroImagej?

Thanks,
Nazlı
Reply | Threaded
Open this post in threaded view
|

Re: Four Light Curves for Same Exoplanet

karenacollins
Administrator

Hi Nazli,

As you perform photometry for each of the four transits individually, save each measurement table to a file. Now open table 1 into AIJ's Multi-Plot using Multi-Plot Main->File->"Open table from file". Next merge table 1 with table 2 using Multi-Plot Main->File->"Append table from file as new columns". This will require you to enter a suffix to append to table 1 data columns and another for table 2 data columns (because all data column names of a combined measurements table must be unique). Use a short 1-5 character suffix so that you can see the full dataset names in the data column selection pull-down menus (i.e. something like _A and _B or _mmdd of the transits). Next merge table 3 in the same way, but leave the "original" table suffix name blank (erase the default underscore symbol) and then choose a suffix for table 3 data columns. Repeat one more time and choose a suffix for table 4 data columns.

Now set up orbital phase X-axis plotting by going to Multi-Plot Main->X-axis->"Set epoch and period for X-axis phase calculation" and enter the Tc of the reference epoch and the orbital period for the planet. Then select Multi-Plot Main->X-axis->"Show X-axis as days since Tc". If you plan to fit the transits, you must use "Show X-axis as days since Tc" and NOT "Show X-axis as hours since Tc. The fitter will not work correctly using hours.

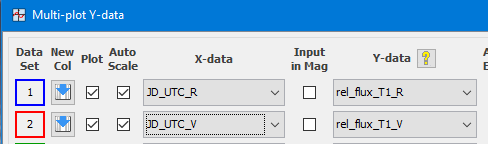
Now go to the Multi-Plot Y-data panel and on four different rows of settings, select the matching "X-data" and "Y-data" time and flux columns, respectively, as shown for two rows below for a set of R-band and V-band transits. This is different that the usual plotting where "default" is normally selected for "X-data" and the default time column for all Y-data sets is selected on the Multi-plot Main panel.

Now set up shift and other plot options, and potentially fit each transit, as desired.

Karen

Reply | Threaded
Open this post in threaded view
|

Re: Four Light Curves for Same Exoplanet

nkaraman
Hi,
Thanks too much for your help. Now i can plot four light curves at same plot window.
Only I am trying to put "title" on each curve. But "Multi Plot Main" has only one "Title" region. How can I put title for each curve?

thank you for your attention,

Regards,
Nazlı
Reply | Threaded
Open this post in threaded view
|

Re: Four Light Curves for Same Exoplanet

karenacollins
Administrator
Use the legend settings on the right- hand side of each row of the Multi-Plot Y-data settings. Select the custom legend setting and type in the text that you want to display. There is also an additional legend setting in the fit panel if you are fitting the light curves. 

Karen

On Oct 27, 2017, at 5:55 AM, nkaraman [via AstroImageJ] <[hidden email]> wrote:

Hi,
Thanks too much for your help. Now i can plot four light curves at same plot window.
Only I am trying to put "title" on each curve. But "Multi Plot Main" has only one "Title" region. How can I put title for each curve?

thank you for your attention,

Regards,
Nazlı


If you reply to this email, your message will be added to the discussion below:
http://astroimagej.1065399.n5.nabble.com/Four-Light-Curves-for-Same-Exoplanet-tp876p879.html
To start a new topic under AstroImageJ, email [hidden email]
To unsubscribe from AstroImageJ, click here.
NAML