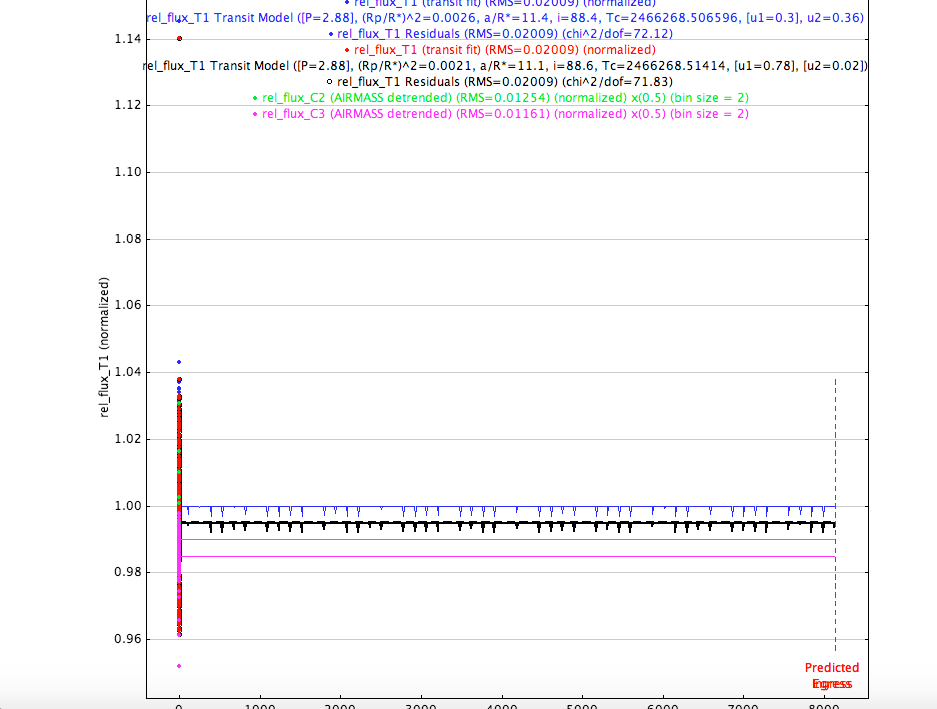
I must admit that in the last few days I have learned quite a bit about exoplanet transits and AIJ but have been unsuccessful in obtaining a light curve of a transit. I discovered that the data that I am using had a meridian flip and also that the pictures were misaligned by quite a bit. I succeeded in aligning the pictures. I ran photometry with all of the images and then with just the images after the meridian flip and the results are essentially the same. I do get straight flat lines for the comparison stars flux but for the target star I get, well, what you see in the attached image, a series of dips in an otherwise straight line. I am at a loss of what this means but it probably does indicate a transit in some way. I just don't know what to do to clean up the graph.
Any ideas would be very much appreciated.
Art

