Differential Photometry with a DSLR
Differential Photometry with a DSLR
|
I've just noticed that my first question has been answered elsewhere! The textbox issue, and I've been doing the correct thing it seems. :-)
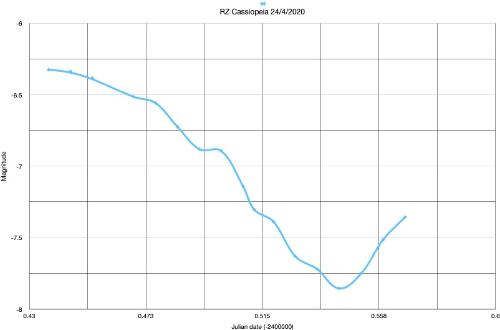
I'm pretty new to this so I hope my next question doesn't across as too simplistic! I'm an amateur and I've become interested in taking a series of photos of a variable, such as RZ Cass as a starter, and then use AIJ to produce a light curve, so it's my methodology that I'm a little unsure of. I'd be interested to know whether I'm dropping any clangers or doing some absolute No, Nos! I took about 85 shots of RZ Cass recently, in batches of 5, each 5 secs long, and the batches were 10 mins apart. I am using a Canon 60D, with a 100mm lens, and I used my telescope mount to track the star. I then use Fitswork to convert the RAW CR2 files into RGB FITS files. I discard the R and B and just use the green. My first problem is that if I stack each batch I lose the time in the FITS header. So I have used AIJ to plot the mag of RZ Cass in all of 85 images, and I have then set up a spreadsheet to measure the average of the 5 images in each batch, and I have used the time from the middle image to plot the graph. Am I correct in stacking the Green FITS images rather than the RAW files? (I forgot to say that I also take calibration shots).Is there a way, either with AIJ or another mean, of stacking images and having the middle time put into the resulting image? For a first attempt I was quite pleased wit the resulting curve, but before I start to think about sending data to the BAA variable star section I want to improve my accuracy so the final question basically is, am I deluding myself that this method will provide worthwhile results? Steve 
|
Re: Differential Photometry with a DSLR
|
Administrator
|
Hi Steve,
I don't have experience with color images for astronomy, so I can't answer all of your questions. But to plot the average of each set of 5 data points, I would leave the images as separate images (i.e. not stack them). Run photometry as usual, then use the "Multi-plot Y-date" "Bin Size" setting at 5. That will average the time and the photometry of each set of 5 images in the light curve plot, which should give the same result as stacking the images and then running photometry. If you want to save you binned time and photometry back to the measurements table, use the "New Col" icon in the same row. Karen |
Re: Differential Photometry with a DSLR
|
Hi Karen,
Great, thank you for this information. I'll give it a go. Steve |
Re: Differential Photometry with a DSLR
|
In reply to this post by karenacollins
Hi Karen,
That little tip was brilliant! Thank you. It is sooo much easier than my clunky little spreadsheet. Two clicks and I have saved myself loads of time and effort. I really must investigate Multi-Plot more thoroughly. I assume that I can draw a best fit curve from somewhere in there? Best wishes Steve |
Re: Differential Photometry with a DSLR
|
Administrator
|
Multi-aperture only supports fitting exoplanet transit models at
this time (which sort of also works for EBs). I believe the
underlying ImageJ platform that AIJ is build on supports fitting
general models, but I have not used it. Check out the extensive
ImageJ online help for that functionality.
Karen On 5/8/2020 5:23 AM,
[hidden email] [via AstroImageJ] wrote:
Hi Karen, |
Re: Differential Photometry with a DSLR
|
Hi Karen,
Sorry to be a pain, can I ask one more question? I'm struggling to work out what the binned value of the Magnitude is actually showing me, it certainly isn't the average magnitude. I've copied below the first set of five results and the binned values. JD_UTC Source_AMag_T1 JD_UTC(binSize=5) Source_AMag_T1_n(binSize=5) 2458964.436 6.342392 2458964.437 1.953827 2458964.437 6.404143 2458964.437 6.332393 2458964.437 6.260715 2458964.437 6.290399 Thanks Steve |
Re: Differential Photometry with a DSLR
|
Administrator
|
Hi Steve,
Base on your information below, this appears to be a bug. I'm swamped right now, but I'll look into the code and report back here when I know more. Karen |
Re: Differential Photometry with a DSLR
|
That’s very kind of you Karen. No rush.
Best wishes Steve
Sent from my iPhone On 13 May 2020, at 09:40, karenacollins [via AstroImageJ] <[hidden email]> wrote:
|
«
Return to How to accomplish specific tasks in AstroImageJ
|
1 view|%1 views
| Free forum by Nabble | Edit this page |

