AIJ help
|
I've followed the user guide to the point where the multiplot main window, measurement window and main plot windows open after selecting the stars but my data looks like it wants to plot in columns in the plot window. In the measurement table there's values for j.d. 240000 and jd_utc as well as the rel_flux_T1,C2,C3 etc. I cant seem to get these values to plot correctly..thanks for any help. BTW, these files have been calibrated in pixinsight. Also, I hadn't had luck plate solving them either with asnvr or nova.astronmetry.net. Do the files need to be plate solved before generating a light curve? Thanks for any help
|
|
Administrator
|
Plate-solving is not required for photometry runs as long as there
are not huge shifts in your pointing from image to image. In the
latter case, you will notice that your apertures loose the stars at
some point during the processing of the stack. Otherwise, you are
okay without plate solutions.
I'm really at a loss as to how to help solve your problem with the given information. I think it would be helpful to share some screen shots of your settings (e.g. multi-aperture setup panel, multiplot panels, the plot image, image display panel showing aperture placement, and anything else that might be relevant). When you say "user guide", are you referring to the standard AIJ user guide or Dennis Conti's user guide? I'd recommend following Dennis' guide if you aren't already doing that. Karen On 2/5/2021 7:01 PM, cmaier [via
AstroImageJ] wrote:
I've followed the user guide to the point where the multiplot main window, measurement window and main plot windows open after selecting the stars but my data looks like it wants to plot in columns in the plot window. In the measurement table there's values for j.d. 240000 and jd_utc as well as the rel_flux_T1,C2,C3 etc. I cant seem to get these values to plot correctly..thanks for any help. BTW, these files have been calibrated in pixinsight. Also, I hadn't had luck plate solving them either with asnvr or nova.astronmetry.net. Do the files need to be plate solved before generating a light curve? Thanks for any help |
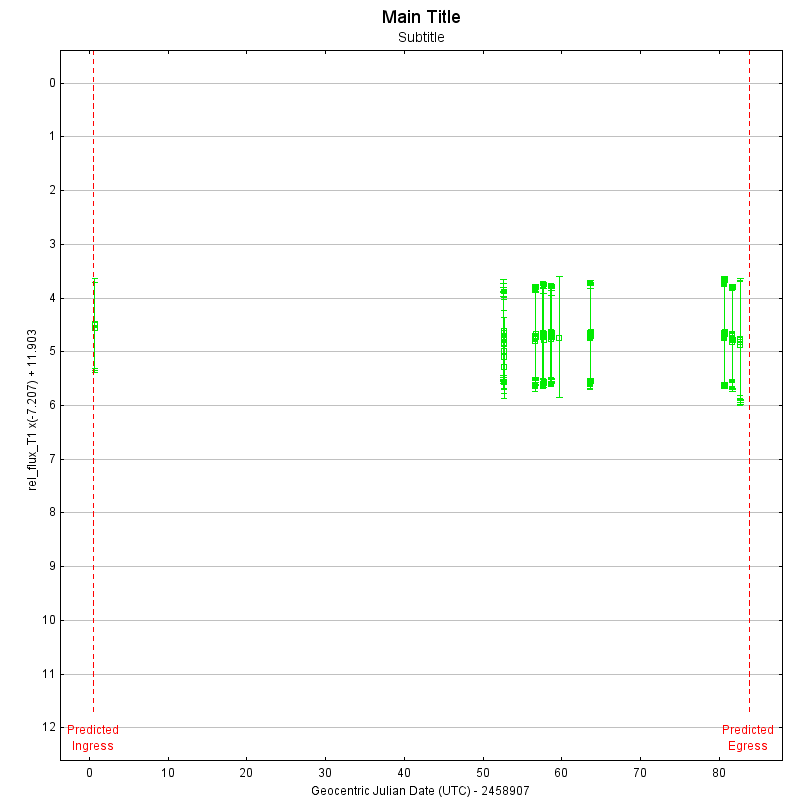
 I was able to plate solve once I moved the index files to the correct location. I'm following Dennis's user guide and the above plot is what I get. seems like the X axis isn't plotting with the correct values I see in the measurement table. One issue is when I select the "update" button under Dynamical time" I get a error, couldn't open link to USNO website, check internet connection. Don't know if this is part of the issue. Thanks for the help, I know this is user error..... |
|
Administrator
|
It appears that you observations covered a time range of ~83 days.
Is that correct? Note that 2458907 has been subtracted from the
X-axis labels to make them less clutter (see the x-axis label).
Given these notes, do you still feel that this plot is incorrect?
Karen On 2/6/2021 2:22 PM, cmaier [via
AstroImageJ] wrote:
|
|
Thanks, the info on the X axis helped. I did take the images over a long time period. There's 160 slices/samples. On the plot, I thought the squares were the samples and they seemed to be aligning in vertical columns.
|
«
Return to AstroImageJ
|
1 view|%1 views
| Free forum by Nabble | Edit this page |


